Starwood 2006 Annual Report Download - page 39
Download and view the complete annual report
Please find page 39 of the 2006 Starwood annual report below. You can navigate through the pages in the report by either clicking on the pages listed below, or by using the keyword search tool below to find specific information within the annual report.-
 1
1 -
2
-
3
-
4
-
5
-
6
-
7
-
8
-
9
-
10
-
11
-
12
-
13
-
14
-
15
-
16
-
17
-
18
-
19
-
20
-
21
-
22
-
23
-
24
-
25
-
26
-
27
-
28
-
 29
29 -
 30
30 -
 31
31 -
 32
32 -
 33
33 -
 34
34 -
 35
35 -
 36
36 -
 37
37 -
 38
38 -
 39
39 -
 40
40 -
 41
41 -
 42
42 -
 43
43 -
 44
44 -
 45
45 -
 46
46 -
 47
47 -
 48
48 -
 49
49 -
50
-
51
-
52
-
53
-
54
-
55
-
56
-
57
-
58
-
59
-
60
-
61
-
62
-
63
-
64
-
65
-
66
-
67
-
68
-
69
-
70
-
71
-
72
-
73
-
74
-
75
-
76
-
77
-
78
-
79
-
80
-
81
-
82
-
83
-
84
-
85
-
86
-
87
-
88
-
89
-
90
-
91
-
92
-
93
-
94
-
95
-
96
-
97
-
98
-
99
-
100
-
101
-
102
-
103
-
104
-
105
-
106
-
107
-
108
-
109
-
110
-
111
-
112
-
113
-
114
-
115
 |
 |
Cumulative Effect of Accounting Change, Net of Tax
On January 1, 2006, we adopted SFAS No. 152 and recorded a charge of $70 million, net of a $46 million tax
benefit, in cumulative effect of accounting change.
Year Ended December 31, 2005 Compared with Year Ended December 31, 2004
Continuing Operations
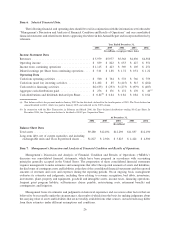
Revenues. Total revenues, including other revenues from managed and franchised properties, were
$5.977 billion, an increase of $609 million when compared to 2004 levels. Revenues reflected a 5.7% increase
in revenues from our owned, leased and consolidated joint venture hotels to $3.517 billion for the year ended
December 31, 2005 when compared to $3.326 billion in the corresponding period of 2004, a 38.9% increase in
vacation ownership and residential revenues to $889 million for the year ended December 31, 2005 when compared
to $640 million in the corresponding period of 2004, a 19.6% increase in management fees, franchise fees and other
income to $501 million for the year ended December 31, 2005 when compared to $419 million in the corresponding
period of 2004 and an increase of $87 million in other revenues from managed and franchised properties to
$1.070 billion for the year ended December 31, 2005 when compared to $983 million in the corresponding period of
2004.
The increase in revenues from owned, leased and consolidated joint venture hotels was due primarily to strong
results at our owned hotels in New York, New York, the Hawaiian Islands, Los Angeles, California, San Diego
California, Atlanta, Georgia, Seattle, Washington and Houston, Texas, partially offset by the loss of business due to
Hurricanes Dennis, Katrina, Rita and Wilma at our two owned hotels and one joint venture hotel in New Orleans,
two owned hotels in Florida and two owned hotels in Cancun, Mexico. Revenues at our Same-Store Owned Hotels
(119 hotels for the years ended December 31, 2005 and 2004, excluding 12 hotels sold or closed and 11 hotels
undergoing significant repositionings or without comparable results in 2005 and 2004) increased 8.2%, or
$240 million, to $3.183 billion for the year ended December 31, 2005 when compared to $2.943 billion in the
same period of 2004 due primarily to an increase in REVPAR. REVPAR at our Same-Store Owned Hotels increased
10.9% to $123.14 for the year ended December 31, 2005 when compared to the corresponding 2004 period. The
increase in REVPAR at these Same-Store Owned Hotels was attributed to increases in occupancy rates to 70.5% in
the year ended December 31, 2005 when compared to 68.3% in the same period in 2004, and a 7.5% increase in
ADR to $174.70 for the year ended December 31, 2005 compared to $162.50 for the corresponding 2004 period.
REVPAR at Same-Store Owned Hotels in North America increased 11.7% for the year ended December 31, 2005
when compared to the same period of 2004 due to increased transient and group travel business for the period,
primarily at our large owned hotels in the major United States cities and destinations discussed above. REVPAR at
our international Same-Store Owned Hotels increased by 8.8% for the year ended December 31, 2005 when
compared to the same period of 2004, with Europe, where we have our biggest concentration of international owned
hotels, increasing 7.8%. REVPAR for Same-Store Owned Hotels internationally increased 6.8% for the year ended
December 31, 2005 excluding the favorable effects of foreign currency translation. REVPAR for Same-Store
Owned Hotels in Europe increased 6.5% excluding the favorable effects of foreign currency translation.
The increase in vacation ownership and residential sales and services of $249 million was primarily due to
sales of residential units at the St. Regis Museum Tower in San Francisco, California, which did not begin until the
fourth quarter of 2004. In the year ended December 31, 2005, we recognized approximately $183 million of
revenues from the San Francisco project compared to sales of $15 million in 2004. The St. Regis Museum Tower
opened in November 2005 with 260 hotel rooms and 102 condominium units. The increase in vacation ownership
and residential sales and services in 2005 was also due to an increase in the sales of VOIs of 11.3% to $591 million
in 2005 compared to $531 million in 2004. These increases represented increased sales volume as well as the
revenue recognition from progressing and completed projects accounted for under the percentage of completion
accounting methodology as required by generally accepted accounting principles primarily at the Westin
Ka’anapali Ocean Resort Villas in Maui, Hawaii, the Westin Kierland Resort and Spa in Scottsdale, Arizona,
and the Sheraton Vistana Villages in Orlando, Florida, partially offset by reduced revenues at the Westin Mission
Hills Resort in Rancho Mirage, California where substantially all of the available inventory was sold. Contract sales
of VOI inventory, which represents vacation ownership revenues before adjustments for percentage of completion
32