Starwood 2006 Annual Report Download - page 41
Download and view the complete annual report
Please find page 41 of the 2006 Starwood annual report below. You can navigate through the pages in the report by either clicking on the pages listed below, or by using the keyword search tool below to find specific information within the annual report.-
 1
1 -
2
-
3
-
4
-
5
-
6
-
7
-
8
-
9
-
10
-
11
-
12
-
13
-
14
-
15
-
16
-
17
-
18
-
19
-
20
-
21
-
22
-
23
-
24
-
25
-
26
-
27
-
28
-
29
-
30
-
 31
31 -
 32
32 -
 33
33 -
 34
34 -
 35
35 -
 36
36 -
 37
37 -
 38
38 -
 39
39 -
 40
40 -
 41
41 -
 42
42 -
 43
43 -
 44
44 -
 45
45 -
 46
46 -
 47
47 -
 48
48 -
 49
49 -
 50
50 -
 51
51 -
52
-
53
-
54
-
55
-
56
-
57
-
58
-
59
-
60
-
61
-
62
-
63
-
64
-
65
-
66
-
67
-
68
-
69
-
70
-
71
-
72
-
73
-
74
-
75
-
76
-
77
-
78
-
79
-
80
-
81
-
82
-
83
-
84
-
85
-
86
-
87
-
88
-
89
-
90
-
91
-
92
-
93
-
94
-
95
-
96
-
97
-
98
-
99
-
100
-
101
-
102
-
103
-
104
-
105
-
106
-
107
-
108
-
109
-
110
-
111
-
112
-
113
-
114
-
115
 |
 |
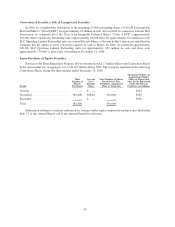
Cancun, Mexico that is being partially demolished to build vacation ownership units. These losses were offset by net
gains recorded on the sale of several hotels in 2005.
During 2004, we recorded a net loss of $33 million primarily related to the sale of two hotels in 2004, the sale
of one hotel in January 2005, and three investments deemed impaired in 2004.
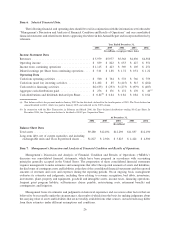
Income Tax Expense. The effective income tax rate for continuing operations for the year ended
December 31, 2005 was 34.1% compared to 10.5% in 2004. The increase was primarily due to $47 million of
tax expense on the adoption of a plan to repatriate foreign earnings in accordance with the American Jobs Creation
Act of 2004 and $52 million of additional tax expense related to our 1998 disposition of ITT World Directories
recorded in 2005. The effective tax rate for the year ended December 31, 2005 also included a net tax credit of
$15 million related to the deferred gain on the sale of the Hotel Danieli in Venice, Italy and an $8 million benefit
related to tax refunds for tax years prior to the 1995 split-up of ITT Corporation. Our effective income tax rate is
determined by the level and composition of pre-tax income subject to varying foreign, state and local taxes and other
items. The effective tax rate for the year ended December 31, 2004 included a $28 million benefit primarily related
to the reversal of tax reserves as a result of the resolution of certain tax matters during the year.
Discontinued Operations
For the year ended December 31, 2005, the loss from operations represented a $2 million sales and use tax
assessment related to periods prior to our disposal of our gaming business, which was disposed of in 1999, offset by
a $1 million income tax benefit related to this business.
For the year ended December 31, 2004, the net gain on dispositions included $16 million related to the
favorable resolution of certain tax matters and $10 million primarily related to the reversal of reserves, both of
which related to our former gaming business. The reserves were reversed as the related contingencies were resolved.
LIQUIDITY AND CAPITAL RESOURCES
Cash From Operating Activities
Cash flow from operating activities is generated primarily from operating income from our owned hotels, sales
of VOIs and residential units and management and franchise revenues. It is the principal source of cash used to fund
our operating expenses, interest payments on debt, capital expenditures, distribution payments and share repur-
chases. We believe that existing borrowing availability together with capacity for additional borrowings and cash
from operations will be adequate to meet all funding requirements for our operating expenses, principal and interest
payments on debt, capital expenditures, dividend payments and share repurchases in the foreseeable future.
State and local regulations governing sales of VOIs allow the purchaser of such a VOI to rescind the sale
subsequent to its completion for a pre-specified number of days or until a certificate of occupancy is obtained. As
such, cash collected from such sales during the rescission period is classified as restricted cash in our consolidated
balance sheets. At December 31, 2006 and 2005, we had short-term restricted cash balances of $329 million and
$295 million, respectively, primarily consisting of such restricted cash.
Cash From Investing Activities
In limited cases, we have made loans to owners of or partners in hotel or resort ventures for which we have a
management or franchise agreement. Loans outstanding under this program, excluding the Westin Boston, Seaport
Hotel discussed below, totaled $55 million at December 31, 2006. We evaluate these loans for impairment, and at
December 31, 2006, believe these loans are collectible. Unfunded loan commitments aggregating $29 million were
outstanding at December 31, 2006, of which $1 million are expected to be funded in 2007 and $11 million are
expected to be funded in total. These loans typically are secured by pledges of project ownership interests and/or
mortgages on the projects. We also have $105 million of equity and other potential contributions associated with
managed or joint venture properties, $23 million of which is expected to be funded in 2007.
34