Starwood 2006 Annual Report Download - page 27
Download and view the complete annual report
Please find page 27 of the 2006 Starwood annual report below. You can navigate through the pages in the report by either clicking on the pages listed below, or by using the keyword search tool below to find specific information within the annual report.-
 1
1 -
2
-
3
-
4
-
5
-
6
-
7
-
8
-
9
-
10
-
11
-
12
-
13
-
14
-
15
-
16
-
 17
17 -
 18
18 -
 19
19 -
 20
20 -
 21
21 -
 22
22 -
 23
23 -
 24
24 -
 25
25 -
 26
26 -
 27
27 -
 28
28 -
 29
29 -
 30
30 -
 31
31 -
 32
32 -
 33
33 -
 34
34 -
 35
35 -
 36
36 -
 37
37 -
38
-
39
-
40
-
41
-
42
-
43
-
44
-
45
-
46
-
47
-
48
-
49
-
50
-
51
-
52
-
53
-
54
-
55
-
56
-
57
-
58
-
59
-
60
-
61
-
62
-
63
-
64
-
65
-
66
-
67
-
68
-
69
-
70
-
71
-
72
-
73
-
74
-
75
-
76
-
77
-
78
-
79
-
80
-
81
-
82
-
83
-
84
-
85
-
86
-
87
-
88
-
89
-
90
-
91
-
92
-
93
-
94
-
95
-
96
-
97
-
98
-
99
-
100
-
101
-
102
-
103
-
104
-
105
-
106
-
107
-
108
-
109
-
110
-
111
-
112
-
113
-
114
-
115
 |
 |

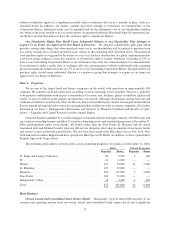
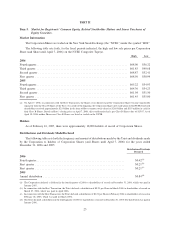
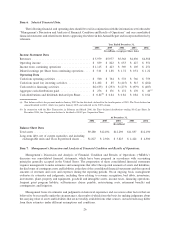
An indicator of the performance of our owned, leased and consolidated joint venture hotels is revenue per
available room (“REVPAR”)
(1)
, as it measures the period-over-period growth in rooms revenue for comparable
properties. This is particularly the case in the United States where there is no impact on this measure from foreign
exchange rates.
The following table summarizes REVPAR, average daily rates (“ADR”) and average occupancy rates on a
year-to-year basis for our 74 owned, leased and consolidated joint venture hotels (excluding 56 hotels sold or closed
and 11 hotels undergoing significant repositionings or without comparable results in 2006 and 2005) (“Same-Store
Owned Hotels”) for the years ended December 31, 2006 and 2005:
2006 2005 Variance
Year Ended
December 31,
Worldwide (74 hotels with approximately 25,000 rooms)
REVPAR ................................................... $136.33 $123.80 10.1%
ADR ...................................................... $191.56 $177.04 8.2%
Occupancy .................................................. 71.2% 69.9% 1.3
North America (43 hotels with approximately 17,000 rooms)
REVPAR ................................................... $135.46 $122.94 10.2%
ADR ...................................................... $185.61 $170.47 8.9%
Occupancy .................................................. 73.0% 72.1% 0.9
International (31 hotels with approximately 8,000 rooms)
REVPAR ................................................... $138.05 $125.51 10.0%
ADR ...................................................... $204.33 $191.38 6.8%
Occupancy .................................................. 67.6% 65.6% 2.0
(1) REVPAR is calculated by dividing room revenue, which is derived from rooms and suites rented or leased, by total room nights available for
a given period. REVPAR may not be comparable to similarly titled measures such as revenues.
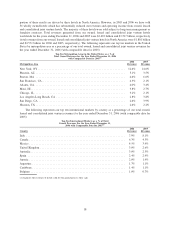
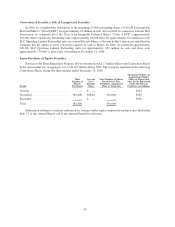
During the years ended December 31, 2006 and 2005, we invested approximately $245 million and
$318 million, respectively, for capital improvements at owned hotels, excluding the inventory expenditures at
the St. Regis Museum Tower in San Francisco, California, discussed below. These capital expenditures included the
renovation of the Sheraton Centre Toronto Hotel in Toronto, Canada, the Westin Resort & Spa in Cancun, Mexico
and the Sheraton Kauai Resort in Kauai, Hawaii.
Managed and Franchised Hotels. Hotel and resort properties in the United States are often owned by
entities that do not manage hotels or own a brand name. Hotel owners typically enter into management contracts
with hotel management companies to operate their hotels. When a management company does not offer a brand
affiliation, the hotel owner often chooses to pay separate franchise fees to secure the benefits of brand marketing,
centralized reservations and other centralized administrative functions, particularly in the sales and marketing area.
Management believes that companies, such as Starwood, that offer both hotel management services and well-
established worldwide brand names appeal to hotel owners by providing the full range of management, marketing
and reservation services.
Managed Hotels. We manage hotels worldwide, usually under a long-term agreement with the hotel owner
(including entities in which we have a minority equity interest). Our responsibilities under hotel management
contracts typically include hiring, training and supervising the managers and employees that operate these facilities.
For additional fees, we provide centralized reservation services and coordinate national advertising and certain
marketing and promotional services. We prepare and implement annual budgets for the hotels we manage and are
responsible for allocating property-owner funds for periodic maintenance and repair of buildings and furnishings. In
addition to our owned and leased hotels, at December 31, 2006, we managed 426 hotels with approximately
20