Shutterfly 2010 Annual Report Download - page 49
Download and view the complete annual report
Please find page 49 of the 2010 Shutterfly annual report below. You can navigate through the pages in the report by either clicking on the pages listed below, or by using the keyword search tool below to find specific information within the annual report.-
 1
1 -
2
-
3
-
4
-
5
-
6
-
7
-
8
-
9
-
10
-
11
-
12
-
13
-
14
-
15
-
16
-
17
-
18
-
19
-
20
-
21
-
22
-
23
-
24
-
25
-
26
-
27
-
28
-
29
-
30
-
31
-
32
-
33
-
34
-
35
-
36
-
37
-
38
-
 39
39 -
 40
40 -
 41
41 -
 42
42 -
 43
43 -
 44
44 -
 45
45 -
 46
46 -
 47
47 -
 48
48 -
 49
49 -
 50
50 -
 51
51 -
 52
52 -
 53
53 -
 54
54 -
 55
55 -
 56
56 -
 57
57 -
 58
58 -
 59
59 -
60
-
61
-
62
-
63
-
64
-
65
-
66
-
67
-
68
-
69
-
70
-
71
-
72
-
73
-
74
-
75
-
76
-
77
-
78
-
79
-
80
-
81
-
82
-
83
-
84
-
85
-
86
-
87
-
88
-
89
-
90
-
91
-
92
-
93
-
94
-
95
-
96
-
97
-
98
-
99
 |
 |
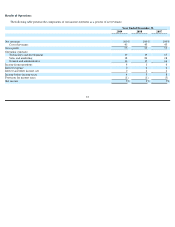
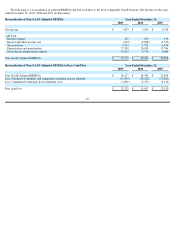
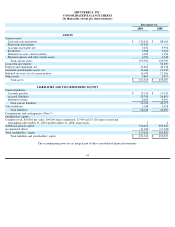
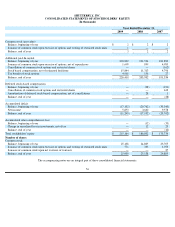
Below is our cash flow activity for the years ended December 31, 2009, 2008 and 2007:
We anticipate that our current cash and cash equivalents balances, cash generated from operations and our credit facility will be sufficient to
meet our working capital requirements, capital lease obligations, expansion plans and technology development projects for at least the
next twelve months. Whether these resources are adequate to meet our liquidity needs beyond that period will depend on our growth, operating
results and the capital expenditures required to meet possible increased demand for our products. If we require additional capital resources to
grow our business internally or to acquire complementary technologies and businesses at any time in the future, we may seek to sell additional
debt or equity. The sale of additional equity could result in additional dilution to our stockholders. Financing arrangements may not be available
to us, or may not be in amounts or on terms acceptable to us.
We anticipate that total 2010 capital expenditures will range between 7% to 9% of our expected net revenues in 2010. These expenditures
will be used to purchase technology and equipment to support the growth in our business and to increase our production capacity and help enable
us to respond more quickly and efficiently to customer demand. Our expenditures also include costs associated with capitalized software and
website development. This range of capital expenditures is not outside the ordinary course of our business or materially different from how we
have expanded our business in the past.
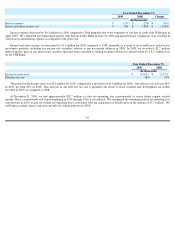
Operating Activities.
For 2009, net cash provided by operating activities was $53.9 million, primarily due to our net income of $5.9 million
and the net change in operating assets and liabilities of $7.4 million, adjusted for non-
cash items including $27.2 million of depreciation and
amortization expense, $2.9 million benefit from deferred income taxes, $1.7 million for tax benefit from stock-
based compensation, and
$14.3 million of stock-based compensation.
For 2008, net cash provided by operating activities was $47.0 million, primarily due to our net income of $3.7 million and the net change in
operating assets and liabilities of $8.0 million, adjusted for non-
cash items including $26.0 million of depreciation and amortization expense,
$0.7 million benefit from deferred income taxes, $0.4 million for tax benefit from stock-based compensation, and $9.8 million of stock-
based
compensation.
For 2007, net cash provided by operating activities was $42.2 million, primarily due to our net income of $9.6 million and the net change in
operating assets and liabilities of $4.2 million, adjusted for non-
cash items including $17.8 million of depreciation and amortization expense,
$5.7 million of provision for deferred income taxes, and $4.7 million of stock-based compensation.
Year Ended December 31,
2009
2008
2007
(In thousands)
Consolidated Statement of Cash Flows Data:
Purchases of property and equipment
$
13,762
$
18,220
$
31,881
Capitalization of software and website development costs
3,891
4,527
3,112
Acquisition of business and intangibles, net of cash acquired
795
10,097
2,858
Depreciation and amortization
27,194
26,038
17,796
Cash flows from operating activities
53,890
47,040
42,192
Cash flows used in investing activities
(14,123
)
(82,086
)
(40,823
)
Cash flows from financing activities
4,881
628
2,162
47