Shutterfly 2010 Annual Report Download - page 43
Download and view the complete annual report
Please find page 43 of the 2010 Shutterfly annual report below. You can navigate through the pages in the report by either clicking on the pages listed below, or by using the keyword search tool below to find specific information within the annual report.-
 1
1 -
2
-
3
-
4
-
5
-
6
-
7
-
8
-
9
-
10
-
11
-
12
-
13
-
14
-
15
-
16
-
17
-
18
-
19
-
20
-
21
-
22
-
23
-
24
-
25
-
26
-
27
-
28
-
29
-
30
-
31
-
32
-
 33
33 -
 34
34 -
 35
35 -
 36
36 -
 37
37 -
 38
38 -
 39
39 -
 40
40 -
 41
41 -
 42
42 -
 43
43 -
 44
44 -
 45
45 -
 46
46 -
 47
47 -
 48
48 -
 49
49 -
 50
50 -
 51
51 -
 52
52 -
 53
53 -
54
-
55
-
56
-
57
-
58
-
59
-
60
-
61
-
62
-
63
-
64
-
65
-
66
-
67
-
68
-
69
-
70
-
71
-
72
-
73
-
74
-
75
-
76
-
77
-
78
-
79
-
80
-
81
-
82
-
83
-
84
-
85
-
86
-
87
-
88
-
89
-
90
-
91
-
92
-
93
-
94
-
95
-
96
-
97
-
98
-
99
 |
 |

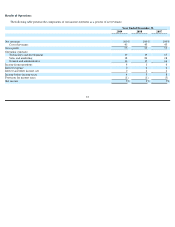
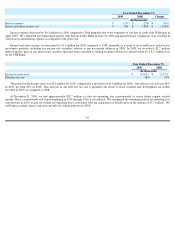
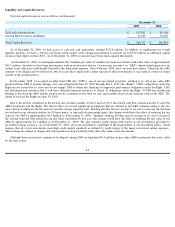
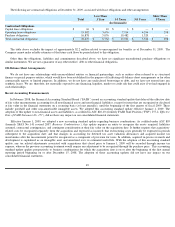
Net income increased by $2.2 million, or 60%, from 2008 to 2009. As a percentage of net revenue, net income was 3% of net revenue for
2009 compared to 2% for 2008.
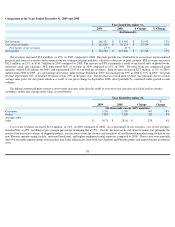
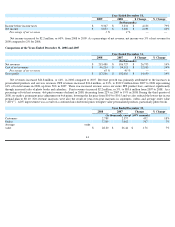
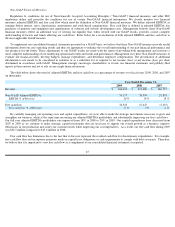
Comparison of the Years Ended December 31, 2008 and 2007
Net revenues increased $26.8 million, or 14%, in 2008 compared to 2007. Revenue growth was primarily attributable to the increases in
personalized products and services revenues. PPS revenues increased $24.6 million, or 23%, to $129.9 million from 2007 to 2008 representing
61% of total revenues in 2008, up from 56% in 2007. There was increased revenue across our entire PPS product base, and most significantly
through increased sales of photo books and calendars. Print revenues increased $2.2 million, or 3%, to $83.6 million from 2007 to 2008. As a
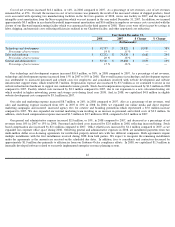
percentage of total net revenue, 4x6 print revenues declined in 2008, decreasing from 22% in 2007 to 19% in 2008. During the third quarter of
2008, we made a permanent price adjustment on 4x6 prints, lowering the list price from $0.19 to $0.15 and we also reduced the lowest tier in our
prepaid plan to $0.10. Net revenue increases were also the result of year-over-
year increases in customers, orders and average order value
(“AOV”). AOV improvement was a result of a continued mix shift from prints to higher value personalized products, particularly photo books.
Year Ended December 31,
2009
2008
$ Change
% Change
(In thousands)
Income before income taxes
$
9,367
$
5,231
$
4,136
79
%
Net income
$
5,853
$
3,660
$
2,193
60
%
Percentage of net revenues
3
%
2
%
—
—
Year Ended December 31,
2008
2007
$ Change
% Change
(In thousands)
Net revenues
$
213,480
$
186,727
$
26,753
14
%
Cost of net revenues
$
96,214
$
84,111
$
12,103
14
%
Percentage of net revenues
45
%
45
%
—
—
Gross profit
$
117,266
$
102,616
$
14,650
14
%
Year Ended December 31,
2008
2007
Change
% Change
(In thousands, except AOV amounts)
Customers
2,789
2,357
432
18
%
Orders
7,569
7,062
507
7
%
Average order
value
$
28.20
$
26.44
$
1.76
7
%
41