Shutterfly 2010 Annual Report Download - page 32
Download and view the complete annual report
Please find page 32 of the 2010 Shutterfly annual report below. You can navigate through the pages in the report by either clicking on the pages listed below, or by using the keyword search tool below to find specific information within the annual report.-
 1
1 -
2
-
3
-
4
-
5
-
6
-
7
-
8
-
9
-
10
-
11
-
12
-
13
-
14
-
15
-
16
-
17
-
18
-
19
-
20
-
21
-
 22
22 -
 23
23 -
 24
24 -
 25
25 -
 26
26 -
 27
27 -
 28
28 -
 29
29 -
 30
30 -
 31
31 -
 32
32 -
 33
33 -
 34
34 -
 35
35 -
 36
36 -
 37
37 -
 38
38 -
 39
39 -
 40
40 -
 41
41 -
 42
42 -
43
-
44
-
45
-
46
-
47
-
48
-
49
-
50
-
51
-
52
-
53
-
54
-
55
-
56
-
57
-
58
-
59
-
60
-
61
-
62
-
63
-
64
-
65
-
66
-
67
-
68
-
69
-
70
-
71
-
72
-
73
-
74
-
75
-
76
-
77
-
78
-
79
-
80
-
81
-
82
-
83
-
84
-
85
-
86
-
87
-
88
-
89
-
90
-
91
-
92
-
93
-
94
-
95
-
96
-
97
-
98
-
99
 |
 |
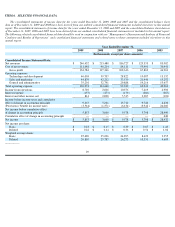
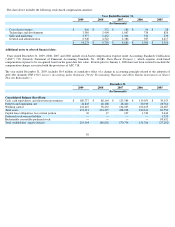
Additional notes to selected financial data:
Years ended December 31, 2009, 2008, 2007 and 2006 include stock-
based compensation expense under Accounting Standards Codification
("ASC") 718 (formerly Statement of Financial Accounting Standards No. 123(R), Share-Based Payment ), which requires stock-
based
compensation expense to be recognized based on the grant date fair value. Periods prior to January 1, 2006 have not been restated to include the
compensation charges associated with the provisions of ASC 718.
The year ended December 31, 2005, includes $0.4 million of cumulative effect of a change in accounting principle related to the adoption of
ASC 480 (formerly FSP 150-5,
Issuer's Accounting under Statement 150 for Freestanding Warrants and Other Similar Instruments on Shares
That Are Redeemable ).
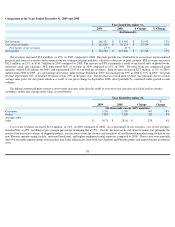
The chart above includes the following stock
-
based compensation amounts:
Year Ended December 31,
2009
2008
2007
2006
2005
(In thousands)
Cost of net revenues
$
416
$
372
$
189
$
96
$
28
Technology and development
3,340
2,404
1,067
736
826
Sales and marketing
3,577
2,452
1,044
521
239
General and administration
6,940
4,522
2,386
947
2,217
$
14,273
$
9,750
$
4,686
$
2,300
$
3,310
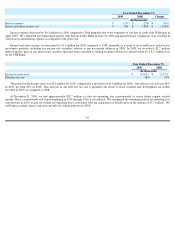
December 31,
2009
2008
2007
2006
2005
(In thousands)
Consolidated Balance Sheet Data:
Cash, cash equivalents, and short term investments
$
180,737
$
88,164
$
125,584
$
119,051
$
39,153
Property and equipment, net
41,845
48,108
48,416
30,919
20,761
Working capital
141,410
58,232
104,025
102,165
22,687
Total assets
271,313
233,297
208,938
180,160
89,552
Capital lease obligations, less current portion
10
17
107
1,742
3,646
Preferred stock warrant liability
—
—
—
—
1,535
Redeemable convertible preferred stock
—
—
—
—
89,652
Total stockholders
’
equity (deficit)
215,164
186,802
170,734
151,326
(27,262
)
30