Shutterfly 2010 Annual Report Download - page 44
Download and view the complete annual report
Please find page 44 of the 2010 Shutterfly annual report below. You can navigate through the pages in the report by either clicking on the pages listed below, or by using the keyword search tool below to find specific information within the annual report.-
 1
1 -
2
-
3
-
4
-
5
-
6
-
7
-
8
-
9
-
10
-
11
-
12
-
13
-
14
-
15
-
16
-
17
-
18
-
19
-
20
-
21
-
22
-
23
-
24
-
25
-
26
-
27
-
28
-
29
-
30
-
31
-
32
-
33
-
 34
34 -
 35
35 -
 36
36 -
 37
37 -
 38
38 -
 39
39 -
 40
40 -
 41
41 -
 42
42 -
 43
43 -
 44
44 -
 45
45 -
 46
46 -
 47
47 -
 48
48 -
 49
49 -
 50
50 -
 51
51 -
 52
52 -
 53
53 -
 54
54 -
55
-
56
-
57
-
58
-
59
-
60
-
61
-
62
-
63
-
64
-
65
-
66
-
67
-
68
-
69
-
70
-
71
-
72
-
73
-
74
-
75
-
76
-
77
-
78
-
79
-
80
-
81
-
82
-
83
-
84
-
85
-
86
-
87
-
88
-
89
-
90
-
91
-
92
-
93
-
94
-
95
-
96
-
97
-
98
-
99
 |
 |

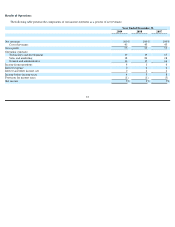
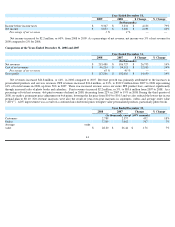
Cost of net revenues increased $12.1 million, or 14%, in 2008 compared to 2007. As a percentage of net revenues, cost of net revenues
remained flat, at 45%. Overall, the increase in cost of net revenues was primarily the result of the increased volume of shipped products, fixed
costs associated with operating two manufacturing facilities in the first two quarters of 2008, versus one facility in 2007, and the impact of
intangible asset amortization from the Nexo acquisition which was not incurred in the year ended December 31, 2007. In addition, we incurred
approximately $0.5 million in accelerated leasehold improvement amortization and $0.6 million in employee severance costs associated with the
closure of our Hayward manufacturing facility which was announced in the third quarter of 2008. These costs were offset in part by savings in
labor, shipping, and materials costs reflecting efficiencies realized in our Charlotte facility, and other negotiated cost reductions.
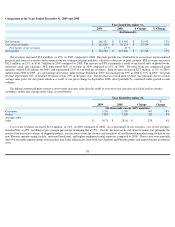
Our technology and development expense increased $10.9 million, or 38%, in 2008 compared to 2007. As a percentage of net revenues,
technology and development expense increased from 15% in 2007 to 19% in 2008. The overall increase in technology and development expense
was attributable to increased personnel and related costs for employees and consultants involved with website development and website
infrastructure support teams, which totaled $3.7 million. Depreciation expense also increased by $3.7 million as we continued to invest in our
website infrastructure hardware to support our continued revenue growth. Stock-
based compensation expense increased by $1.3 million in 2008
compared to 2007. Facility related costs increased by $2.3 million compared to 2007, due to our expansion to a new colocation hosting site
which resulted in higher networking, power and storage costs during fiscal year 2008. And, in 2008, we capitalized $4.8 million in eligible
website development costs compared to $3.1 million in 2007.
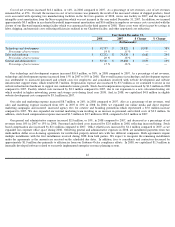
Our sales and marketing expense increased $8.7 million, or 26%, in 2008 compared to 2007. Also as a percentage of net revenues, total
sales and marketing expense increased from 18% in 2007 to 20% in 2008. In 2008, we expanded our online media and direct response
marketing campaigns and incurred increased agency fees for creative and branding promotions which represented a $5.0 million increase
compared to 2007. We also expanded our internal marketing team resulting in an increase in personnel and related costs of $2.2 million. In
addition, stock-based compensation expense increased $1.5 million to $2.5 million in 2008, compared to $1.0 million in 2007.
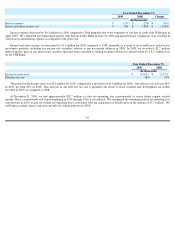
Our general and administrative expense increased $2.9 million, or 10%, in 2008 compared to 2007, and decreased as a percentage of net
revenues from 16% in 2007 to 15% in 2008. Personnel and related costs increased by $2.0 million in 2008, reflecting increased hiring. Stock
based compensation also increased by $2.1 million compared to 2007. Office related costs increased by $1.1 million compared to 2007, as we
expanded our corporate office space during 2008. Offsetting general and administrative expenses in 2008, are installment payments from two
multi-million dollar cross-
licensing agreements for intellectual property entered into with two different companies. Both agreements require
multiple installments with the first installments received during 2008 from both parties. We expect to recognize the remaining installments
under the agreements as the amounts are received on the scheduled due dates. In addition, fees to consultants and contractors decreased by
approximately $1.0 million due primarily to efficiencies from our Sarbanes-
Oxley compliance efforts. In 2008, we capitalized $1.3 million in
internally developed software related to our newly implemented enterprise resource planning system.
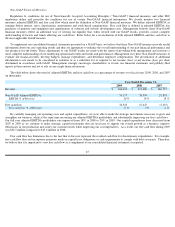
Year Ended December 31,
2008
2007
$ Change
% Change
(In thousands)
Technology and development
$
39,707
$
28,822
$
10,885
38
%
Percentage of net revenues
19
%
15
%
—
—
Sales and marketing
$
42,212
$
33,530
$
8,682
26
%
Percentage of net revenues
20
%
18
%
—
—
General and administrative
$
32,741
$
29,888
$
2,853
10
%
Percentage of net revenues
15
%
16
%
—
—
42