Shutterfly 2010 Annual Report Download - page 31
Download and view the complete annual report
Please find page 31 of the 2010 Shutterfly annual report below. You can navigate through the pages in the report by either clicking on the pages listed below, or by using the keyword search tool below to find specific information within the annual report.-
 1
1 -
2
-
3
-
4
-
5
-
6
-
7
-
8
-
9
-
10
-
11
-
12
-
13
-
14
-
15
-
16
-
17
-
18
-
19
-
20
-
 21
21 -
 22
22 -
 23
23 -
 24
24 -
 25
25 -
 26
26 -
 27
27 -
 28
28 -
 29
29 -
 30
30 -
 31
31 -
 32
32 -
 33
33 -
 34
34 -
 35
35 -
 36
36 -
 37
37 -
 38
38 -
 39
39 -
 40
40 -
 41
41 -
42
-
43
-
44
-
45
-
46
-
47
-
48
-
49
-
50
-
51
-
52
-
53
-
54
-
55
-
56
-
57
-
58
-
59
-
60
-
61
-
62
-
63
-
64
-
65
-
66
-
67
-
68
-
69
-
70
-
71
-
72
-
73
-
74
-
75
-
76
-
77
-
78
-
79
-
80
-
81
-
82
-
83
-
84
-
85
-
86
-
87
-
88
-
89
-
90
-
91
-
92
-
93
-
94
-
95
-
96
-
97
-
98
-
99
 |
 |
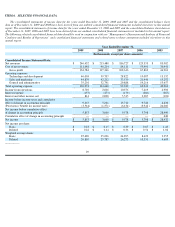
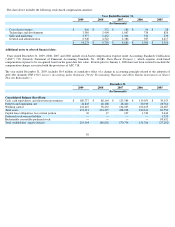
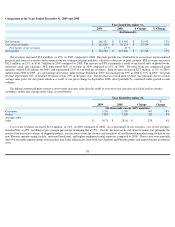
ITEM 6. SELECTED FINANCIAL DATA.
The consolidated statements of income data for the years ended December 31,
2009, 2008 and 2007 and the consolidated balance sheet
data as of December 31, 2009 and 2008 have been derived from our audited consolidated financial statements
included elsewhere in this annual
report. The consolidated statements of income data for the years ended December 31, 2006 and 2005 and the consolidated balance
sheet data as
of December 31, 2007, 2006 and 2005 have been derived from our
audited consolidated financial statements not included in this annual report.
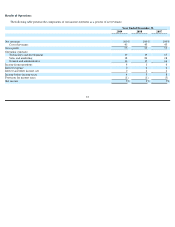
The following selected consolidated financial data should be read in conjunction with our “Management’
s Discussion and Analysis of Financial
Condition and Results of Operations” and consolidated financial statements and related notes to those
statements included elsewhere in this
annual report.
__________
Year Ended December 31,
2009
2008
2007
2006
2005
(In thousands, except per share amounts)
Consolidated Income Statement Data:
Net revenues
$
246,432
$
213,480
$
186,727
$
123,353
$
83,902
Cost of net revenues
111,648
96,214
84,111
55,491
36,941
Gross profit
134,784
117,266
102,616
67,862
46,961
Operating expenses:
Technology and development
46,003
39,707
28,822
19,087
13,152
Sales and marketing
44,870
42,212
33,530
21,940
15,252
General and administrative
35,201
32,741
29,888
19,216
13,657
Total operating expense
126,074
114,660
92,240
60,243
42,061
Income from operations
8,710
2,606
10,376
7,619
4,900
Interest expense
(157
)
(273
)
(179
)
(266
)
(367
)
Interest and other income, net
814
2,898
5,515
2,387
(103
)
Income before income taxes and cumulative
effect of change in accounting principle
9,367
5,231
15,712
9,740
4,430
(Provision) / benefit for income taxes
(3,514
)
(1,571
)
(6,134
)
(3,942
)
24,060
Net income before cumulative effect
of change in accounting principle
5,853
3,660
9,578
5,798
28,490
Cumulative effect of change in accounting principle
—
—
—
—
442
Net income
$
5,853
$
3,660
$
9,578
$
5,798
$
28,932
Net income per share:
Basic
$
0.23
$
0.15
$
0.39
$
0.67
$
1.45
Diluted
$
0.22
$
0.14
$
0.36
$
0.56
$
1.02
Weighted average shares
Basic
25,420
25,036
24,295
8,622
3,255
Diluted
26,810
25,787
26,273
10,331
4,609
29