Shutterfly 2010 Annual Report Download - page 40
Download and view the complete annual report
Please find page 40 of the 2010 Shutterfly annual report below. You can navigate through the pages in the report by either clicking on the pages listed below, or by using the keyword search tool below to find specific information within the annual report.-
 1
1 -
2
-
3
-
4
-
5
-
6
-
7
-
8
-
9
-
10
-
11
-
12
-
13
-
14
-
15
-
16
-
17
-
18
-
19
-
20
-
21
-
22
-
23
-
24
-
25
-
26
-
27
-
28
-
29
-
 30
30 -
 31
31 -
 32
32 -
 33
33 -
 34
34 -
 35
35 -
 36
36 -
 37
37 -
 38
38 -
 39
39 -
 40
40 -
 41
41 -
 42
42 -
 43
43 -
 44
44 -
 45
45 -
 46
46 -
 47
47 -
 48
48 -
 49
49 -
 50
50 -
51
-
52
-
53
-
54
-
55
-
56
-
57
-
58
-
59
-
60
-
61
-
62
-
63
-
64
-
65
-
66
-
67
-
68
-
69
-
70
-
71
-
72
-
73
-
74
-
75
-
76
-
77
-
78
-
79
-
80
-
81
-
82
-
83
-
84
-
85
-
86
-
87
-
88
-
89
-
90
-
91
-
92
-
93
-
94
-
95
-
96
-
97
-
98
-
99
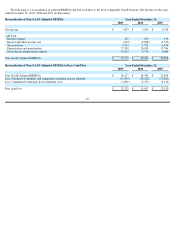
 |
 |

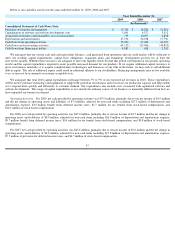
Comparison of the Years Ended December 31, 2009 and 2008
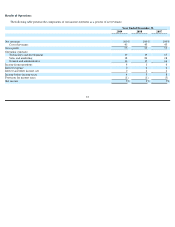
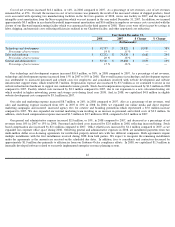
Net revenues increased $33.0 million, or 15%, in 2009 compared to 2008. Revenue growth was attributable to an increase in personalized
products and services revenues and revenue from our commercial print initiative, offset by a decrease in print revenue. PPS revenues increased
$32.1 million, or 25%, to $161.7 million in 2009 compared to 2008. The increase in PPS is primarily a result of increased sales of photo books,
stationery cards and calendars. PPS represented 66% of revenue in 2009 compared to 61% in 2008. Revenue from our commercial print
initiative totaled $3.8 million for 2009, and represented 1.6% of our total net revenues. Print revenue decreased $2.7 million, or 3%, to $80.9
million from 2008 to 2009. As a percentage of revenue, print revenue declined in 2009, decreasing from 39% in 2008 to 33% in 2009. 4x6 print
revenue represented 14% of total net revenues versus 19% in the prior year. The decrease in overall print revenue was primarily due to a lower
average sales price for 4x6 prints which is a result of our price change in September 2008, offset partially by continued stable growth in unit
volumes.
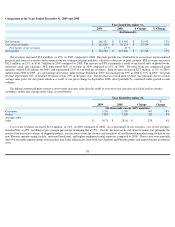
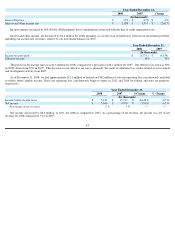
Excluding commercial print revenues, net revenue increases were also the result of year-over-year increases in each of our key metrics:
customers, orders and average order value, as noted below:
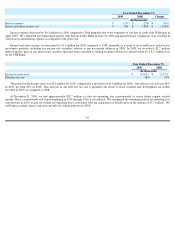
Cost of net revenues increased $15.4 million, or 16%, in 2009 compared to 2008. As a percentage of net revenues, cost of net revenues
remained flat, at 45%, resulting in gross margin percentage remaining flat at 55%. Overall, the increase in cost of net revenues was primarily the
result of the increased volume of shipped products, cost increases from the closure and transition of our Hayward manufacturing facility to our
new Phoenix manufacturing facility, increased headcount, and higher equipment rental expenses compared to 2008. These costs were partially
offset by favorable improvements from product mix, labor efficiencies from both our Charlotte and Phoenix plants and improvements in material
costs.
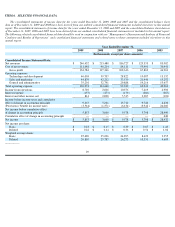
Year Ended December 31,
2009
2008
$ Change
% Change
(In thousands)
Net revenues
$
246,432
$
213,480
$
32,952
15
%
Cost of net revenues
$
111,648
$
96,214
$
15,434
16
%
Percentage of net revenues
45
%
45
%
—
—
Gross profit
$
134,784
$
117,266
$
17,518
15
%
Year Ended December 31,
2009
2008
Change
%
Change
(In thousands, except AOV amounts)
Customers
3,281
2,789
493
18
%
Orders
7,891
7,569
322
4
%
Average order
value
$
30.74
$
28.16
$
2.58
9
%
38