Rosetta Stone 2014 Annual Report Download - page 97
Download and view the complete annual report
Please find page 97 of the 2014 Rosetta Stone annual report below. You can navigate through the pages in the report by either clicking on the pages listed below, or by using the keyword search tool below to find specific information within the annual report.-
 1
1 -
2
-
3
-
4
-
5
-
6
-
7
-
8
-
9
-
10
-
11
-
12
-
13
-
14
-
15
-
16
-
17
-
18
-
19
-
20
-
21
-
22
-
23
-
24
-
25
-
26
-
27
-
28
-
29
-
30
-
31
-
32
-
33
-
34
-
35
-
36
-
37
-
38
-
39
-
40
-
41
-
42
-
43
-
44
-
45
-
46
-
47
-
48
-
49
-
50
-
51
-
52
-
53
-
54
-
55
-
56
-
57
-
58
-
59
-
60
-
61
-
62
-
63
-
64
-
65
-
66
-
67
-
68
-
69
-
70
-
71
-
72
-
73
-
74
-
75
-
76
-
77
-
78
-
79
-
80
-
81
-
82
-
83
-
84
-
85
-
86
-
 87
87 -
 88
88 -
 89
89 -
 90
90 -
 91
91 -
 92
92 -
 93
93 -
 94
94 -
 95
95 -
 96
96 -
 97
97 -
 98
98 -
 99
99 -
 100
100 -
 101
101 -
 102
102 -
 103
103 -
 104
104 -
 105
105 -
 106
106 -
 107
107 -
108
-
109
-
110
-
111
-
112
-
113
-
114
-
115
-
116
-
117
-
118
-
119
-
120
-
121
-
122
-
123
-
124
-
125
-
126
-
127
-
128
-
129
-
130
-
131
-
132
-
133
-
134
-
135
-
136
-
137
-
138
-
139
-
140
-
141
-
142
-
143
-
144
-
145
-
146
-
147
-
148
-
149
-
150
-
151
-
152
-
153
-
154
-
155
-
156
-
157
-
158
-
159
-
160
-
161
-
162
-
163
-
164
-
165
-
166
-
167
-
168
-
169
-
170
-
171
-
172
-
173
-
174
-
175
-
176
-
177
-
178
-
179
-
180
-
181
-
182
-
183
-
184
-
185
-
186
-
187
-
188
-
189
-
190
-
191
-
192
-
193
-
194
-
195
-
196
-
197
-
198
-
199
-
200
-
201
-
202
-
203
-
204
-
205
-
206
-
207
-
208
-
209
-
210
 |
 |

Table of Contents
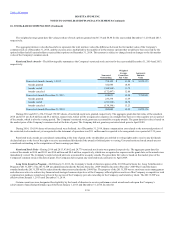
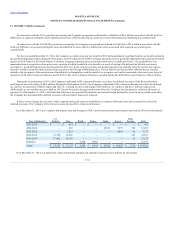
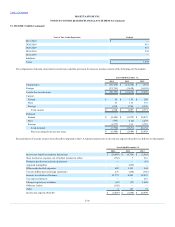
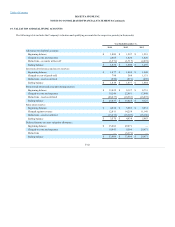
Operating results by segment for the years ended December 31, 2014, 2013, and 2012 were as follows (in thousands):
North America consumer
$ 153,003
$ 174,016
$ 172,826
Rest of world consumer
24,150
30,420
40,248
Global Enterprise & Education
84,700
60,209
60,167
Total revenue
$ 261,853
$ 264,645
$ 273,241
North America consumer
$ 33,770
$ 72,511
$ 70,767
Rest of world consumer
1,104
(1,627)
(3,536)
Global Enterprise & Education
16,104
20,965
26,621
Total segment contribution
50,978
91,849
93,852
Unallocated cost of sales
8,947
4,586
6,104
Unallocated sales and marketing
8,984
16,447
16,633
Unallocated research and development
33,176
33,993
23,455
Unallocated general and administrative
54,576
54,423
52,926
Unallocated non-operating expense/(income)
1,345
(424)
(190)
Unallocated impairment
20,333
—
—
Unallocated lease abandonment
3,812
842
—
Total unallocated expenses, net
131,173
109,867
98,928
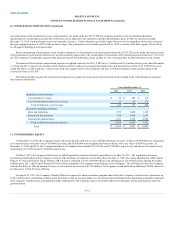
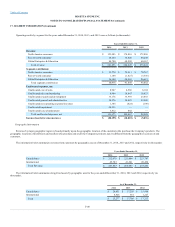
Revenue by major geographic region is based primarily upon the geographic location of the customers who purchase the Company's products. The
geographic locations of distributors and resellers who purchase and resell the Company's products may be different from the geographic locations of end
customers.
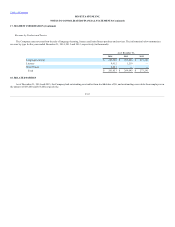
The information below summarizes revenue from customers by geographic area as of December 31, 2014, 2013 and 2012, respectively (in thousands):
United States
$ 212,070
$ 223,404
$ 223,747
International
49,783
41,241
49,494
Total Revenue
$ 261,853
$ 264,645
$ 273,241
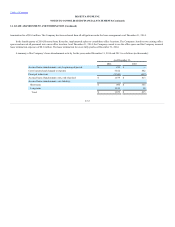
The information below summarizes long-lived assets by geographic area for the years ended December 31, 2014, 2013 and 2012, respectively (in
thousands):
United States
$ 20,451
$ 17,205
$ 15,986
International
4,826
561
1,227
Total
$ 25,277
$ 17,766
$ 17,213
F-40