Rosetta Stone 2014 Annual Report Download - page 72
Download and view the complete annual report
Please find page 72 of the 2014 Rosetta Stone annual report below. You can navigate through the pages in the report by either clicking on the pages listed below, or by using the keyword search tool below to find specific information within the annual report.-
 1
1 -
2
-
3
-
4
-
5
-
6
-
7
-
8
-
9
-
10
-
11
-
12
-
13
-
14
-
15
-
16
-
17
-
18
-
19
-
20
-
21
-
22
-
23
-
24
-
25
-
26
-
27
-
28
-
29
-
30
-
31
-
32
-
33
-
34
-
35
-
36
-
37
-
38
-
39
-
40
-
41
-
42
-
43
-
44
-
45
-
46
-
47
-
48
-
49
-
50
-
51
-
52
-
53
-
54
-
55
-
56
-
57
-
58
-
59
-
60
-
61
-
 62
62 -
 63
63 -
 64
64 -
 65
65 -
 66
66 -
 67
67 -
 68
68 -
 69
69 -
 70
70 -
 71
71 -
 72
72 -
 73
73 -
 74
74 -
 75
75 -
 76
76 -
 77
77 -
 78
78 -
 79
79 -
 80
80 -
 81
81 -
 82
82 -
83
-
84
-
85
-
86
-
87
-
88
-
89
-
90
-
91
-
92
-
93
-
94
-
95
-
96
-
97
-
98
-
99
-
100
-
101
-
102
-
103
-
104
-
105
-
106
-
107
-
108
-
109
-
110
-
111
-
112
-
113
-
114
-
115
-
116
-
117
-
118
-
119
-
120
-
121
-
122
-
123
-
124
-
125
-
126
-
127
-
128
-
129
-
130
-
131
-
132
-
133
-
134
-
135
-
136
-
137
-
138
-
139
-
140
-
141
-
142
-
143
-
144
-
145
-
146
-
147
-
148
-
149
-
150
-
151
-
152
-
153
-
154
-
155
-
156
-
157
-
158
-
159
-
160
-
161
-
162
-
163
-
164
-
165
-
166
-
167
-
168
-
169
-
170
-
171
-
172
-
173
-
174
-
175
-
176
-
177
-
178
-
179
-
180
-
181
-
182
-
183
-
184
-
185
-
186
-
187
-
188
-
189
-
190
-
191
-
192
-
193
-
194
-
195
-
196
-
197
-
198
-
199
-
200
-
201
-
202
-
203
-
204
-
205
-
206
-
207
-
208
-
209
-
210
 |
 |

Table of Contents
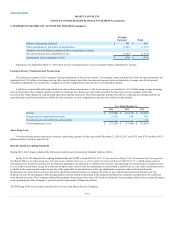
fair value as of the grant date and recognized as expense in the statement of operations on a straight-line basis over the requisite service period, which is the
vesting period.
Net loss per share is computed under the provisions of ASC topic 260, . Basic loss per share is computed using net loss and the
weighted average number of shares of common stock outstanding. Diluted loss per share reflect the weighted average number of shares of common stock
outstanding plus any potentially dilutive shares outstanding during the period. Potentially dilutive shares consist of shares issuable upon the exercise of
stock options, restricted stock awards, restricted stock units and conversion of shares of preferred stock. Common stock equivalent shares are excluded from
the diluted computation if their effect is anti-dilutive. When there is a net loss, there is a presumption that there are no dilutive shares as these would be anti-
dilutive.
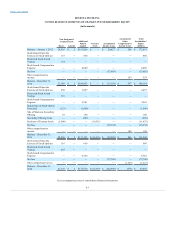
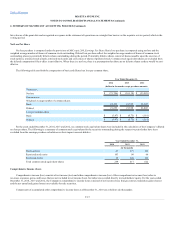
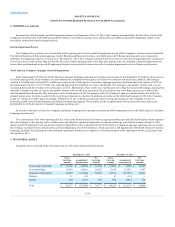
The following table sets forth the computation of basic and diluted net loss per common share:
Net loss
$ (73,706)
$ (16,134)
$ (33,985)
Weighted average number of common shares:
Basic
21,253
21,528
21,045
Diluted
21,253
21,528
21,045
Loss per common share:
Basic
$ (3.47)
$ (0.75)
$ (1.61)
Diluted
$ (3.47)
$ (0.75)
$ (1.61)
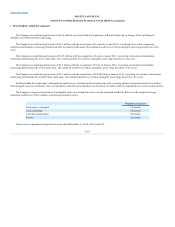
For the years ended December 31, 2014, 2013 and 2012, no common stock equivalent shares were included in the calculation of the Company’s diluted
net loss per share. The following is a summary of common stock equivalents for the securities outstanding during the respective periods that have been
excluded from the earnings per share calculations as their impact was anti-dilutive.
Stock options
67
279
363
Restricted stock units
103
90
66
Restricted stocks
89
248
193
Total common stock equivalent shares
259
617
622
Comprehensive income (loss) consists of net income (loss) and other comprehensive income (loss). Other comprehensive income (loss) refers to
revenues, expenses, gains, and losses that are not included in net income (loss), but rather are recorded directly in stockholders' equity. For the years ended
December 31, 2014, 2013 and 2012, the Company's comprehensive income (loss) consisted of net income (loss), foreign currency translation gains (losses)
and the net unrealized gains (losses) on available-for-sale securities.
Components of accumulated other comprehensive income (loss) as of December 31, 2014 are as follows (in thousands):
F-15