Rosetta Stone 2014 Annual Report Download - page 44
Download and view the complete annual report
Please find page 44 of the 2014 Rosetta Stone annual report below. You can navigate through the pages in the report by either clicking on the pages listed below, or by using the keyword search tool below to find specific information within the annual report.-
 1
1 -
2
-
3
-
4
-
5
-
6
-
7
-
8
-
9
-
10
-
11
-
12
-
13
-
14
-
15
-
16
-
17
-
18
-
19
-
20
-
21
-
22
-
23
-
24
-
25
-
26
-
27
-
28
-
29
-
30
-
31
-
32
-
33
-
 34
34 -
 35
35 -
 36
36 -
 37
37 -
 38
38 -
 39
39 -
 40
40 -
 41
41 -
 42
42 -
 43
43 -
 44
44 -
 45
45 -
 46
46 -
 47
47 -
 48
48 -
 49
49 -
 50
50 -
 51
51 -
 52
52 -
 53
53 -
 54
54 -
55
-
56
-
57
-
58
-
59
-
60
-
61
-
62
-
63
-
64
-
65
-
66
-
67
-
68
-
69
-
70
-
71
-
72
-
73
-
74
-
75
-
76
-
77
-
78
-
79
-
80
-
81
-
82
-
83
-
84
-
85
-
86
-
87
-
88
-
89
-
90
-
91
-
92
-
93
-
94
-
95
-
96
-
97
-
98
-
99
-
100
-
101
-
102
-
103
-
104
-
105
-
106
-
107
-
108
-
109
-
110
-
111
-
112
-
113
-
114
-
115
-
116
-
117
-
118
-
119
-
120
-
121
-
122
-
123
-
124
-
125
-
126
-
127
-
128
-
129
-
130
-
131
-
132
-
133
-
134
-
135
-
136
-
137
-
138
-
139
-
140
-
141
-
142
-
143
-
144
-
145
-
146
-
147
-
148
-
149
-
150
-
151
-
152
-
153
-
154
-
155
-
156
-
157
-
158
-
159
-
160
-
161
-
162
-
163
-
164
-
165
-
166
-
167
-
168
-
169
-
170
-
171
-
172
-
173
-
174
-
175
-
176
-
177
-
178
-
179
-
180
-
181
-
182
-
183
-
184
-
185
-
186
-
187
-
188
-
189
-
190
-
191
-
192
-
193
-
194
-
195
-
196
-
197
-
198
-
199
-
200
-
201
-
202
-
203
-
204
-
205
-
206
-
207
-
208
-
209
-
210
 |
 |

Table of Contents
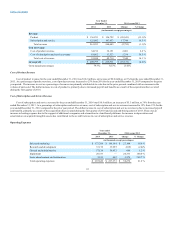
Sales and Marketing Expenses
Sales and marketing expenses for the year ended December 31, 2014 were $173.2 million, an increase of $27.1 million, or 19%, from the year ended
December 31, 2013. As a percentage of total revenue, sales and marketing expenses were 66% for the year ended December 31, 2014, and 55% for the year
ended December 31, 2013. The dollar and percentage increases in sales and marketing expenses were primarily attributable to a $11.0 million increase in
media expense due to increased internet and social media marketing campaigns, partially offset by decreased spend in television and print as online
marketing was determined to be more cost-effective. Increased marketing expenses of $4.9 million related to the "millennial" advertising campaign using
newly developed creative which runs across television, videos and our website, the new 2014 online chat support services feature, and an increase in general
media expenses to drive visits, leads and bookings. In 2014 there was a $5.4 million increase in payroll and a $1.6 million increase in benefits expenses as a
result of our acquisitions. In addition, there was a $5.5 million increase in commission expense mainly driven from the increased bookings in the Global
Enterprise & Education segment, slightly offset by a decrease in commission expense for the ROW Consumer segment. There was a $1.5 million increase in
third party services driven from new social media monitoring services, increased email messaging and related overage fees. Additionally, there was a $2.0
million increase in depreciation and amortization on acquired intangible assets. These increases were partially offset by a $2.3 million decrease in
professional services driven from decreased spend in call centers, $1.9 million decrease in rent and related lease termination expenses due to the closure of
the remaining kiosks in the second quarter of 2013, and removal of kiosk staffing support that did not recur in 2014. While the overall yield on marketing
spend in our NA Consumer segment has declined, we expect that we will continue marketing and advertising media campaigns to generate sufficient web
visits and leads in order to grow overall bookings.
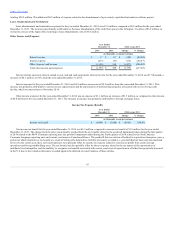
Research and Development Expenses
Research and development expenses were $33.2 million for the year ended December 31, 2014, a decrease of $0.8 million, or 2%, from the year ended
December 31, 2013. As a percentage of revenue, research and development expenses remained flat at 13% for the years ended December 31, 2014 and 2013.
The dollar decrease was primarily attributable to a $2.9 million decrease in payroll expense due to the increased level of capitalized labor costs associated
with the development of new service offerings and a decrease in severance compensation expenses driven from the software development team re-
organization during the year ended December 31, 2013. An additional $0.5 million decrease of research and development expenses was driven from the
reduction of relocation expense related to the hiring of a new software development team in 2013. These decreases were partially offset by a $0.7 million
increase in benefits due to the additional employee costs as a result of the acquisitions, a $1.5 million increase in amortization expense related to acquired
intangible assets, and a $0.5 million increase in rent expense due to the opening of new offices in Austin, TX and San Francisco, CA, and taking over leases
through acquisitions in various locations, including Seattle, WA and Concord, MA.
General and Administrative Expenses
General and administrative expenses for the year ended December 31, 2014 were $57.1 million, an increase of $0.7 million, or 1%, from the year ended
December 31, 2013. As a percentage of revenue, general and administrative expenses increased to 22% for the year ended December 31, 2014 compared to
21% for year ended December 31, 2013. The dollar and percentage increases were primarily attributable to a $1.3 million increase in building expenses
related to a Japan office lease termination and higher dues and subscription fees incurred by the human resources and finance groups. The dollar increase was
also attributable to a $1.0 million increase in bad debt expense driven from increased accounts receivable aging and additional reserves related to acquired
receivables. In addition, general and administrative expense increased $0.5 million due to increased acquisition related software and systems maintenance
and integration work performed during the year ended December 31, 2014. These increases were partially offset by a $1.3 million decrease in payroll due to a
decrease in long-term incentive plan expense and bonus expense as well as a decrease in restricted stock and stock option expenses as a result of the decrease
in our stock price during the year ended December 31, 2014. Rent expense also decreased by $0.6 million due to the lease abandonment of the Arlington,
Virginia 6th floor lease during early 2014.
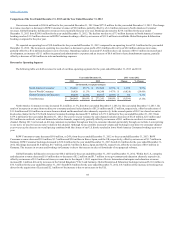
Impairment
Impairment expense for the year ended December 31, 2014 was $20.3 million, an increase of $20.3 million, from the year ended December 31, 2013.
The increase was primarily attributable to a $2.2 million goodwill impairment charge related to our ROW Consumer reporting unit taken in the first quarter of
2014 and an $18.0 million goodwill impairment charge related to North America Consumer Language reporting unit taken in the fourth quarter of 2014. The
goodwill impairment charges were primarily a result of the decline in demand for consumer language-learning products and services at their current pricing
levels and a change in international go-to-market strategy. In an effort to compensate for the consumer preferences, we lowered our prices and used retail
partnerships to increase sales. Despite these actions, the results were significantly lower than the forecasted sales. As a result of the above events, we
performed an impairment analysis and determined that the North America Consumer Language and the ROW Consumer reporting units were fully impaired
and recorded goodwill impairment charges
42