Rosetta Stone 2014 Annual Report Download - page 37
Download and view the complete annual report
Please find page 37 of the 2014 Rosetta Stone annual report below. You can navigate through the pages in the report by either clicking on the pages listed below, or by using the keyword search tool below to find specific information within the annual report.-
 1
1 -
2
-
3
-
4
-
5
-
6
-
7
-
8
-
9
-
10
-
11
-
12
-
13
-
14
-
15
-
16
-
17
-
18
-
19
-
20
-
21
-
22
-
23
-
24
-
25
-
26
-
 27
27 -
 28
28 -
 29
29 -
 30
30 -
 31
31 -
 32
32 -
 33
33 -
 34
34 -
 35
35 -
 36
36 -
 37
37 -
 38
38 -
 39
39 -
 40
40 -
 41
41 -
 42
42 -
 43
43 -
 44
44 -
 45
45 -
 46
46 -
 47
47 -
48
-
49
-
50
-
51
-
52
-
53
-
54
-
55
-
56
-
57
-
58
-
59
-
60
-
61
-
62
-
63
-
64
-
65
-
66
-
67
-
68
-
69
-
70
-
71
-
72
-
73
-
74
-
75
-
76
-
77
-
78
-
79
-
80
-
81
-
82
-
83
-
84
-
85
-
86
-
87
-
88
-
89
-
90
-
91
-
92
-
93
-
94
-
95
-
96
-
97
-
98
-
99
-
100
-
101
-
102
-
103
-
104
-
105
-
106
-
107
-
108
-
109
-
110
-
111
-
112
-
113
-
114
-
115
-
116
-
117
-
118
-
119
-
120
-
121
-
122
-
123
-
124
-
125
-
126
-
127
-
128
-
129
-
130
-
131
-
132
-
133
-
134
-
135
-
136
-
137
-
138
-
139
-
140
-
141
-
142
-
143
-
144
-
145
-
146
-
147
-
148
-
149
-
150
-
151
-
152
-
153
-
154
-
155
-
156
-
157
-
158
-
159
-
160
-
161
-
162
-
163
-
164
-
165
-
166
-
167
-
168
-
169
-
170
-
171
-
172
-
173
-
174
-
175
-
176
-
177
-
178
-
179
-
180
-
181
-
182
-
183
-
184
-
185
-
186
-
187
-
188
-
189
-
190
-
191
-
192
-
193
-
194
-
195
-
196
-
197
-
198
-
199
-
200
-
201
-
202
-
203
-
204
-
205
-
206
-
207
-
208
-
209
-
210
 |
 |

Table of Contents
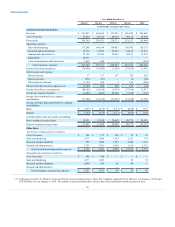
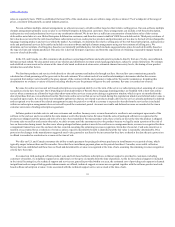
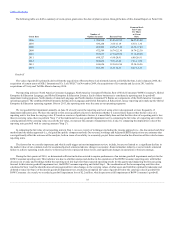
The following table sets forth a summary of stock option grants since the date of plan inception, through the date of this Annual Report on Form 10-K:
2006
1,704,950
$3.85-$3.85
$4.57-$5.92
2007
436,254
3.85-11.19
6.35-11.30
2008
402,805
10.36-17.49
10.36-17.49
2009
472,589
16.74-22.30
16.74-22.30
2010
593,017
17.10-25.99
17.10-25.99
2011
698,327
6.88-20.91
6.88-20.91
2012
662,856
7.51-13.89
7.51-13.89
2013
636,656
12.34-16.96
12.34-16.96
2014
663,353
8.23-12.33
8.23-12.33
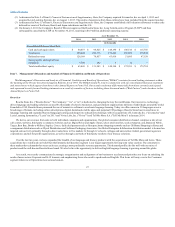
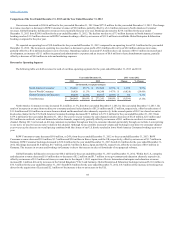
The value of goodwill is primarily derived from the acquisition of Rosetta Stone Ltd. (formerly known as Fairfield & Sons, Ltd.) in January 2006, the
acquisition of certain assets of SGLC International Co. Ltd ("SGLC") in November 2009, the acquisitions of Livemocha and Lexia in 2013 and the
acquisitions of Vivity and Tell Me More in January 2014.
Our reporting units are: North America Consumer Language, North America Consumer Fit Brains, Rest of World Consumer ("ROW Consumer"), Global
Enterprise & Education Language, and Global Enterprise & Education Literacy. Each of these businesses is considered a reporting unit for goodwill
impairment testing purposes. North America Consumer Language and North America Consumer Fit Brains are components of the North America Consumer
operating segment. The combined Global Enterprise & Education Language and Global Enterprise & Education Literacy reporting units make up the Global
Enterprise & Education operating segment. Prior to 2013, the reporting units were the same as our operating segments.
We test goodwill for impairment annually on June 30 of each year at the reporting unit level using a fair value approach or more frequently, if
impairment indicators arise. We have the option to first assess qualitative factors to determine whether it is more likely than not that the fair value of a
reporting unit is less than its carrying value. If, based on a review of qualitative factors, it is more likely than not that the fair value of a reporting unit is less
than its carrying value, then we perform "Step 1" of the traditional two-step goodwill impairment test by comparing the fair value of a reporting unit with its
carrying amount. If the carrying value exceeds the fair value, we measure the amount of impairment loss, if any, by comparing the implied fair value of the
reporting unit goodwill with its carrying amount ("Step 2").
In estimating the fair value of our reporting units in Step 1, we use a variety of techniques including the income approach (i.e., the discounted cash flow
method) and the market approach (i.e., the guideline public company method). Our revenue, bookings and Adjusted EBITDA projections are estimates that
can significantly affect the outcome of the analysis, both in terms of our ability to accurately project future results and in the allocation of fair value between
reporting units.
The factors that we consider important, and which could trigger an interim impairment review, include, but are not limited to: a significant decline in
the market value of our common stock for a sustained period; a material adverse change in economic, financial market, industry or sector trends; a material
failure to achieve operating results relative to historical levels or projected future levels; and significant changes in operations or business strategy.
During the first quarter of 2014, we determined sufficient indication existed to require performance of an interim goodwill impairment analysis for the
ROW Consumer reporting unit. This indicator was due to a further unexpected decline in the operations of the ROW Consumer reporting unit, with further
decreases in revenue and bookings within the reporting unit driving lower than expected operating results for the quarter and impacting the forecast going
forward. In this interim goodwill impairment test, the ROW Consumer reporting unit failed Step 1. The combination of the lower reporting unit fair value
calculated in Step 1 and the identification of unrecognized fair value changes to the carrying values of other assets and liabilities (primarily tradename and
deferred revenue) in Step 2 of the interim goodwill impairment test, resulted in an implied fair value of goodwill below the carrying value of goodwill for
ROW Consumer. As a result, we recorded a goodwill impairment loss of $2.2 million, which represents a full impairment of ROW Consumer’s goodwill.
35