Rosetta Stone 2014 Annual Report Download - page 100
Download and view the complete annual report
Please find page 100 of the 2014 Rosetta Stone annual report below. You can navigate through the pages in the report by either clicking on the pages listed below, or by using the keyword search tool below to find specific information within the annual report.-
 1
1 -
2
-
3
-
4
-
5
-
6
-
7
-
8
-
9
-
10
-
11
-
12
-
13
-
14
-
15
-
16
-
17
-
18
-
19
-
20
-
21
-
22
-
23
-
24
-
25
-
26
-
27
-
28
-
29
-
30
-
31
-
32
-
33
-
34
-
35
-
36
-
37
-
38
-
39
-
40
-
41
-
42
-
43
-
44
-
45
-
46
-
47
-
48
-
49
-
50
-
51
-
52
-
53
-
54
-
55
-
56
-
57
-
58
-
59
-
60
-
61
-
62
-
63
-
64
-
65
-
66
-
67
-
68
-
69
-
70
-
71
-
72
-
73
-
74
-
75
-
76
-
77
-
78
-
79
-
80
-
81
-
82
-
83
-
84
-
85
-
86
-
87
-
88
-
89
-
 90
90 -
 91
91 -
 92
92 -
 93
93 -
 94
94 -
 95
95 -
 96
96 -
 97
97 -
 98
98 -
 99
99 -
 100
100 -
 101
101 -
 102
102 -
 103
103 -
 104
104 -
 105
105 -
 106
106 -
 107
107 -
 108
108 -
 109
109 -
 110
110 -
111
-
112
-
113
-
114
-
115
-
116
-
117
-
118
-
119
-
120
-
121
-
122
-
123
-
124
-
125
-
126
-
127
-
128
-
129
-
130
-
131
-
132
-
133
-
134
-
135
-
136
-
137
-
138
-
139
-
140
-
141
-
142
-
143
-
144
-
145
-
146
-
147
-
148
-
149
-
150
-
151
-
152
-
153
-
154
-
155
-
156
-
157
-
158
-
159
-
160
-
161
-
162
-
163
-
164
-
165
-
166
-
167
-
168
-
169
-
170
-
171
-
172
-
173
-
174
-
175
-
176
-
177
-
178
-
179
-
180
-
181
-
182
-
183
-
184
-
185
-
186
-
187
-
188
-
189
-
190
-
191
-
192
-
193
-
194
-
195
-
196
-
197
-
198
-
199
-
200
-
201
-
202
-
203
-
204
-
205
-
206
-
207
-
208
-
209
-
210
 |
 |

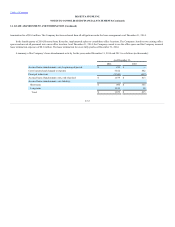
Table of Contents
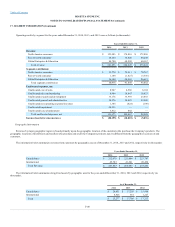
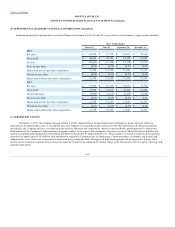
Summarized quarterly supplemental consolidated financial information for 2014 and 2013 are as follows (in thousands, except per share amounts):
2014
Revenue
$ 60,765
$ 57,315
$ 64,515
$ 79,258
Gross profit
$ 48,594
$ 45,355
$ 51,528
$ 63,322
Net loss
$ (20,241)
$ (15,750)
$ (16,178)
$ (21,537)
Basic loss per share
$ (0.96)
$ (0.74)
$ (0.76)
$ (1.01)
Shares used in basic per share computation
21,125
21,252
21,305
21,327
Diluted loss per share
$ (0.96)
$ (0.74)
$ (0.76)
$ (1.01)
Shares used in diluted per share computation
21,125
21,252
21,305
21,327
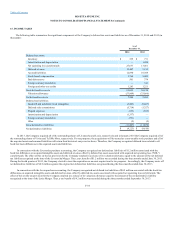
2013
Revenue
$ 63,924
$ 62,139
$ 60,872
$ 77,710
Gross profit
$ 53,660
$ 51,915
$ 50,128
$ 63,228
Net income (loss)
$ (4,904)
$ (3,213)
$ (4,169)
$ (3,848)
Basic loss per share
$ (0.23)
$ (0.15)
$ (0.19)
$ 0.18
Shares used in basic per share computation
21,360
21,569
21,827
21,353
Diluted loss per share
$ (0.23)
$ (0.15)
$ (0.19)
$ (0.18)
Shares used in diluted per share computation
21,360
21,569
21,827
21,353
On March 11, 2015, the Company announced that it will be implementing a reorganization and realignment to pursue the most attractive
opportunities for shareholder value. To accomplish this, the Company is accelerating its plan to prioritize the Global Enterprise & Education segment.
Specifically, the Company will focus on addressing the needs of educators and corporations, where the most profitable growth potential is anticipated.
Simultaneously, the Company is implementing a program to reduce costs as part of an alignment of resources around its Global Enterprise & Education
segment, including reducing global non-Enterprise & Education headcount by approximately 15%. This program is expected to result in annual expense
reductions of approximately $50 million with optimization targeted in Consumer sales and marketing, Consumer product investment, and general and
administrative costs. These cost savings will be reinvested into growing the Global Enterprise & Education segment and are expected to largely offset
declines in the Consumer segment. These actions are expected to result in an estimated $7 million charge in the first quarter of 2015, largely reflecting cash
separation payments.
F-43