Rosetta Stone 2014 Annual Report Download - page 48
Download and view the complete annual report
Please find page 48 of the 2014 Rosetta Stone annual report below. You can navigate through the pages in the report by either clicking on the pages listed below, or by using the keyword search tool below to find specific information within the annual report.-
 1
1 -
2
-
3
-
4
-
5
-
6
-
7
-
8
-
9
-
10
-
11
-
12
-
13
-
14
-
15
-
16
-
17
-
18
-
19
-
20
-
21
-
22
-
23
-
24
-
25
-
26
-
27
-
28
-
29
-
30
-
31
-
32
-
33
-
34
-
35
-
36
-
37
-
 38
38 -
 39
39 -
 40
40 -
 41
41 -
 42
42 -
 43
43 -
 44
44 -
 45
45 -
 46
46 -
 47
47 -
 48
48 -
 49
49 -
 50
50 -
 51
51 -
 52
52 -
 53
53 -
 54
54 -
 55
55 -
 56
56 -
 57
57 -
 58
58 -
59
-
60
-
61
-
62
-
63
-
64
-
65
-
66
-
67
-
68
-
69
-
70
-
71
-
72
-
73
-
74
-
75
-
76
-
77
-
78
-
79
-
80
-
81
-
82
-
83
-
84
-
85
-
86
-
87
-
88
-
89
-
90
-
91
-
92
-
93
-
94
-
95
-
96
-
97
-
98
-
99
-
100
-
101
-
102
-
103
-
104
-
105
-
106
-
107
-
108
-
109
-
110
-
111
-
112
-
113
-
114
-
115
-
116
-
117
-
118
-
119
-
120
-
121
-
122
-
123
-
124
-
125
-
126
-
127
-
128
-
129
-
130
-
131
-
132
-
133
-
134
-
135
-
136
-
137
-
138
-
139
-
140
-
141
-
142
-
143
-
144
-
145
-
146
-
147
-
148
-
149
-
150
-
151
-
152
-
153
-
154
-
155
-
156
-
157
-
158
-
159
-
160
-
161
-
162
-
163
-
164
-
165
-
166
-
167
-
168
-
169
-
170
-
171
-
172
-
173
-
174
-
175
-
176
-
177
-
178
-
179
-
180
-
181
-
182
-
183
-
184
-
185
-
186
-
187
-
188
-
189
-
190
-
191
-
192
-
193
-
194
-
195
-
196
-
197
-
198
-
199
-
200
-
201
-
202
-
203
-
204
-
205
-
206
-
207
-
208
-
209
-
210
 |
 |

Table of Contents
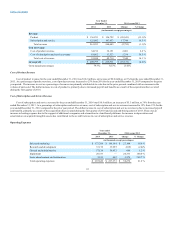
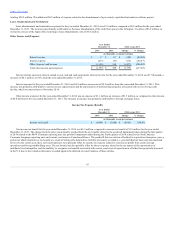
Cost of product revenue for the year ended December 31, 2013 was $32.2 million, a decrease of $1.5 million, or 4% from the year ended December 31,
2012. As a percentage of product revenue, cost of product revenue increased to 20% from 19% for the year ended December 31, 2013 compared to the prior
year period. The percent increase in cost as a percentage of revenue was primarily attributable to a decline in product revenue while fixed costs remained the
same. The dollar decrease in cost of product is due to the decrease in product revenue.
Cost of Subscription and Service Revenue
Cost of subscription and service revenue for the year ended December 31, 2013 was $13.5 million, a decrease of $1.7 million, or 11% from the year
ended December 31, 2012. As a percentage of subscription and service revenue, cost of subscription and service revenue decreased to 13% from 17% for the
year ended December 31, 2013 compared to the prior year period. Beginning in the fourth quarter of 2012, we capped the number of studio sessions
compared to our former unlimited policy, decreasing our coaching costs for the year-ended December 31, 2013.
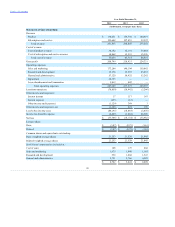
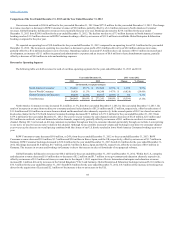
Sales and marketing
$ 146,104
$ 150,882
$ (4,778)
(3.2)%
Research and development
33,995
23,453
10,542
44.9 %
General and administrative
56,432
55,262
1,170
2.1 %
Lease abandonment and termination
842
—
842
100.0 %
Total operating expenses
$ 237,373
$ 229,597
$ 7,776
3.4 %
Sales and Marketing Expenses
Sales and marketing expenses for the year ended December 31, 2013 were $146.1 million, a decrease of $4.8 million, or 3%, from the year ended
December 31, 2012. As a percentage of total revenue, sales and marketing expenses were 55% for the years ended December 31, 2013, and 2012. The dollar
decrease in sales and marketing expenses were primarily attributable to a $2.8 million decrease in rent as the number of kiosk leases decreased from 87 at
December 31, 2012 to three as of December 31, 2013. We exited our U.S. kiosks in the second quarter of 2013. In addition, media and marketing expenses
decreased $1.7 million as we focused our efforts on advertising through online channels such as Facebook, Google AdWords, and email, and less on more
expensive television and radio commercials, which generally drive potential customers to our call centers. Professional services expenses decreased
$2.7 million. These decreases were partially offset by a $2.1 million increase in payroll and benefits from the addition of Lexia and Livemocha personnel,
severance expenses and the 2013 long-term incentive plan and a $1.1 million increase in amortization due to the intangible assets acquired in the Livemocha
and Lexia acquisitions.
Research and Development Expenses
Research and development expenses were $34.0 million for the year ended December 31, 2013, an increase of $10.5 million, or 45%, from the year
ended December 31, 2012. As a percentage of revenue, research and development expenses increased to 13% from 9% for the year ended December 31, 2013
compared to the year ended December 31, 2012. The dollar and percentage increases were the result of our investment in strengthening our platforms and
bringing new innovative products to market including the opening of our new offices in San Francisco, CA and Austin, TX in the first quarter of 2013 and our
newly acquired office in Seattle, WA with the acquisition of Livemocha in April 2013. Compensation and relocation expenses increased $5.1 million as a
result of hiring more senior level managers as well as hiring in the more expensive markets of San Francisco, CA, and Seattle, WA. As a result of opening new
offices in 2013, rent expenses increased $0.6 million. In addition, with the acquisitions of Livemocha and Lexia, amortization of intangible assets increased
$0.5 million. Consulting expenses increased $3.6 million as we continue to develop new products.
General and Administrative Expenses
General and administrative expenses for the year ended December 31, 2013 were $56.4 million, an increase of $1.2 million, or 2%, from the year ended
December 31, 2012. As a percentage of revenue, general and administrative expenses increased to 21% for the year ended December 31, 2013 compared to
20% for year ended December 31, 2012. The dollar and percentage increases were primarily attributable to a $1.0 million increase in personnel related
expenses due to the start of the 2013 Rosetta Stone Inc. Long Term Incentive Plan ("2013 LTIP"), $0.5 million increase in professional services and a $0.4
46