Rosetta Stone 2014 Annual Report Download - page 31
Download and view the complete annual report
Please find page 31 of the 2014 Rosetta Stone annual report below. You can navigate through the pages in the report by either clicking on the pages listed below, or by using the keyword search tool below to find specific information within the annual report.-
 1
1 -
2
-
3
-
4
-
5
-
6
-
7
-
8
-
9
-
10
-
11
-
12
-
13
-
14
-
15
-
16
-
17
-
18
-
19
-
20
-
 21
21 -
 22
22 -
 23
23 -
 24
24 -
 25
25 -
 26
26 -
 27
27 -
 28
28 -
 29
29 -
 30
30 -
 31
31 -
 32
32 -
 33
33 -
 34
34 -
 35
35 -
 36
36 -
 37
37 -
 38
38 -
 39
39 -
 40
40 -
 41
41 -
42
-
43
-
44
-
45
-
46
-
47
-
48
-
49
-
50
-
51
-
52
-
53
-
54
-
55
-
56
-
57
-
58
-
59
-
60
-
61
-
62
-
63
-
64
-
65
-
66
-
67
-
68
-
69
-
70
-
71
-
72
-
73
-
74
-
75
-
76
-
77
-
78
-
79
-
80
-
81
-
82
-
83
-
84
-
85
-
86
-
87
-
88
-
89
-
90
-
91
-
92
-
93
-
94
-
95
-
96
-
97
-
98
-
99
-
100
-
101
-
102
-
103
-
104
-
105
-
106
-
107
-
108
-
109
-
110
-
111
-
112
-
113
-
114
-
115
-
116
-
117
-
118
-
119
-
120
-
121
-
122
-
123
-
124
-
125
-
126
-
127
-
128
-
129
-
130
-
131
-
132
-
133
-
134
-
135
-
136
-
137
-
138
-
139
-
140
-
141
-
142
-
143
-
144
-
145
-
146
-
147
-
148
-
149
-
150
-
151
-
152
-
153
-
154
-
155
-
156
-
157
-
158
-
159
-
160
-
161
-
162
-
163
-
164
-
165
-
166
-
167
-
168
-
169
-
170
-
171
-
172
-
173
-
174
-
175
-
176
-
177
-
178
-
179
-
180
-
181
-
182
-
183
-
184
-
185
-
186
-
187
-
188
-
189
-
190
-
191
-
192
-
193
-
194
-
195
-
196
-
197
-
198
-
199
-
200
-
201
-
202
-
203
-
204
-
205
-
206
-
207
-
208
-
209
-
210
 |
 |

Table of Contents
associated with short-term online services that are bundled with our product software units. Approximately $25 to $39 in revenue per product
software unit is derived from service revenues associated with this short-term online service.
• As of the end of a specified period, the number of paid, active consumer language-learners derived from the sale of our web-
based software subscription and purchasers of our product software who subsequently purchase renewals of their short-term online services.
• Revenues derived from paid online learners for a specified period divided by the average number
of paid online learners during the same period, adjusted to a monthly rate. The average number of paid online learners for a quarter is calculated as
the average of the beginning and ending number of paid online learners for the specified period. The average number of paid online learners for a
year-to-date period is calculated as the average of the average number of paid online learners for quarters included in the specified year-to-date
period.
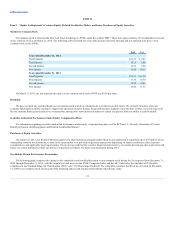
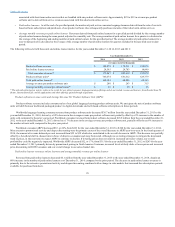
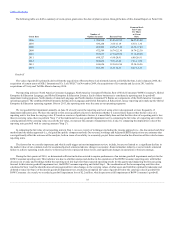
The following table sets forth these unit and online learner metrics for the years ended December 31, 2014, 2013 and 2012:
Product software revenue
$ 148,472
$ 179,211
$ 198,075
Paid online learner revenues
24,595
24,703
14,999
Total consumer revenues*
$ 173,067
$ 203,914
$ 213,074
Product software units*
743,074
681,612
629,779
Total paid online learners*
169,152
94,056
68,393
Average revenue per product software unit
$ 200
$ 263
$ 315
Average monthly revenue per online learner*
$ 16
$ 25
$ 26
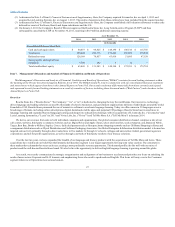
Product software revenue includes consumer sales of our global language-learning product software units. We anticipate the mix of product software
units will shift from our traditional packaged product to digital downloads and web-based software subscriptions in future periods.
Worldwide language-learning consumer revenue from product software units decreased $30.7 million from the year ended December 31, 2013 to the
year ended December 31, 2014, driven by a 24% decrease in the average revenue per product software unit, partially offset by a 9% increase in the number of
units sold, compared to the prior year period. Worldwide consumer revenue from product software decreased $18.9 million from the year ended December 31,
2012 to the year ended December 31, 2013, driven by a 17% decrease in the average revenue per product software unit, partially offset by an 8% increase in
the number of units sold, compared to the prior year period.
Worldwide consumer ARPU decreased $63, or 24%, from $263 for the year ended December 31, 2013 to $200 for the year ended December 31, 2014.
More extensive promotional activity and deeper discounting were the primary causes of the overall decrease in ARPU year-over-year. In the fourth quarter of
2014, the amount of revenue deferred per unit increased from $25 to $39 which also contributed to the overall decrease in ARPU. This decrease was partially
offset by a beneficial shift in channel mix in favor of direct-to-consumer and away from retail. Although we are testing strategies to mitigate the downward
trend in prices, in the near term we expect ARPU to continue to decline. If lowering prices does not result in increased unit sales volume, our overall
profitability could be negatively impacted. Worldwide ARPU decreased $52, or 17%, from $315 for the year ended December 31, 2012 to $263 for the year
ended December 31, 2013 primarily driven by promotional pricing in North America Consumer, increased levels of daily deals at lower prices and increased
price discounting in ROW Consumer, and our overall change in our sales channel mix.
Revenue from paid online learners decreased $0.1 million from the year ended December 31, 2013 to the year ended December 31, 2014, despite an
80% increase in the number of paid online learners as of December 31, 2014, compared to the prior period. The decrease in paid online learner revenues is
primarily due to the extensive promotional activity and deeper discounting combined with a change in sales models that increased the subscription periods
available for purchase from short-
29