Rosetta Stone 2014 Annual Report Download - page 30
Download and view the complete annual report
Please find page 30 of the 2014 Rosetta Stone annual report below. You can navigate through the pages in the report by either clicking on the pages listed below, or by using the keyword search tool below to find specific information within the annual report.-
 1
1 -
2
-
3
-
4
-
5
-
6
-
7
-
8
-
9
-
10
-
11
-
12
-
13
-
14
-
15
-
16
-
17
-
18
-
19
-
 20
20 -
 21
21 -
 22
22 -
 23
23 -
 24
24 -
 25
25 -
 26
26 -
 27
27 -
 28
28 -
 29
29 -
 30
30 -
 31
31 -
 32
32 -
 33
33 -
 34
34 -
 35
35 -
 36
36 -
 37
37 -
 38
38 -
 39
39 -
 40
40 -
41
-
42
-
43
-
44
-
45
-
46
-
47
-
48
-
49
-
50
-
51
-
52
-
53
-
54
-
55
-
56
-
57
-
58
-
59
-
60
-
61
-
62
-
63
-
64
-
65
-
66
-
67
-
68
-
69
-
70
-
71
-
72
-
73
-
74
-
75
-
76
-
77
-
78
-
79
-
80
-
81
-
82
-
83
-
84
-
85
-
86
-
87
-
88
-
89
-
90
-
91
-
92
-
93
-
94
-
95
-
96
-
97
-
98
-
99
-
100
-
101
-
102
-
103
-
104
-
105
-
106
-
107
-
108
-
109
-
110
-
111
-
112
-
113
-
114
-
115
-
116
-
117
-
118
-
119
-
120
-
121
-
122
-
123
-
124
-
125
-
126
-
127
-
128
-
129
-
130
-
131
-
132
-
133
-
134
-
135
-
136
-
137
-
138
-
139
-
140
-
141
-
142
-
143
-
144
-
145
-
146
-
147
-
148
-
149
-
150
-
151
-
152
-
153
-
154
-
155
-
156
-
157
-
158
-
159
-
160
-
161
-
162
-
163
-
164
-
165
-
166
-
167
-
168
-
169
-
170
-
171
-
172
-
173
-
174
-
175
-
176
-
177
-
178
-
179
-
180
-
181
-
182
-
183
-
184
-
185
-
186
-
187
-
188
-
189
-
190
-
191
-
192
-
193
-
194
-
195
-
196
-
197
-
198
-
199
-
200
-
201
-
202
-
203
-
204
-
205
-
206
-
207
-
208
-
209
-
210
 |
 |

Table of Contents
rather than trying to address the entire consumer marketplace. To position the organization for success, we are doing four things:
1. We are taking immediate action to reorganize our business around or Enterprise and Education segment;
2. We will be focusing our product investment on building effective, personalized English learning experiences that deliver clear and measurable
outcomes;
3. We are beginning to right-size the entire cost base of the Company, with the first steps being
◦ optimization of our media spend and other marketing costs in Consumer sales and marketing;
◦ rationing our Consumer investment; and
◦ reducing our general and administrative costs.
4. We are cutting back on the number of new business initiatives we take on - particularly in Consumer - to improve focus and enhance efficacy.
In pursuing these priorities, we plan to grow the Global Enterprise & Education segment by focusing the majority of our resources and assets on
providing a comprehensive language learning experience focused on more serious language learners while at the same time accelerating the migration of our
Consumer business to digital as well as reducing the number of marketing and promotional campaigns aimed at the casual learner, relying less on
promotional pricing to generate Consumer sales, reducing the number of retailers that sell our products, and streamlining operations with a clear focus to
support the Global Enterprise & Education segment.
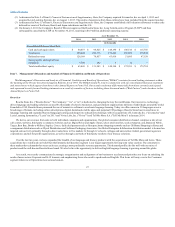
We have three operating segments: North America ("NA") Consumer; Rest of World ("ROW") Consumer; and Global Enterprise & Education.
We discuss the profitability of each segment in terms of segment contribution. Segment contribution is the measure of profitability used by our Chief
Operating Decision Maker ("CODM"). Segment contribution includes segment revenue and expenses incurred directly by the segment, including material
costs, service costs, customer care and coaching costs, sales and marketing expense and bad debt expense. North America Consumer segment contribution
decreased from $72.5 million for the year ended December 31, 2013 to $33.8 million for the year ended December 31, 2014. The decrease in North America
Consumer segment contribution is primarily due to a decrease in retail and direct-to-consumer revenues. ROW Consumer segment contribution increased
from a loss of $1.6 million for the year ended December 31, 2013 to income of $1.1 million for the year ended December 31, 2014 driven by a reduction in
expenses primarily the result of the reduced size of operations in Japan and Korea. Global Enterprise & Education segment contribution decreased to $16.1
million for the year ended December 31, 2014 as compared to $21.0 million for the year ended December 31, 2013, due to an increase in sales and marketing
expense related to the addition of sales staff, particularly from the Lexia and Tell Me More acquisitions and the lower margin on our acquired service
offerings. The decline in Global Enterprise & Education segment contribution is also due to the greater amount of commission earned by resellers of our
literacy services.
For additional information regarding our segments, see Note 17 of Item 8, . For additional information
regarding fluctuations in segment revenue, see Results of Operations, below. Prior periods are presented consistently with our current operating segments and
definition of segment contribution.
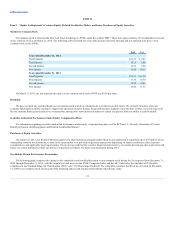
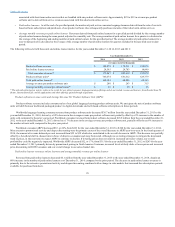
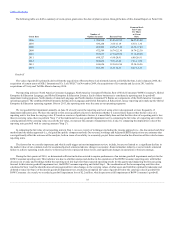
Management uses the following key business metrics to measure the success of sales of our legacy Rosetta Stone language-learning solutions in our
combined North America and ROW Consumer segments. Management does not review these metrics at a disaggregated segment level. In addition,
management does not currently use any comparable metrics to measure success of our Global Enterprise & Education segment nor does management
currently have a business metric to measure success of our Rosetta Stone Fit Brains and Rosetta Stone Kids offerings. These business metrics do not include
product software units, revenues, or learners gained from acquisitions.
• A unit is a perpetual software license sold as either tangible packaged software or as a digital download.
• Consumer revenues derived from product software units divided by the number of product software
units sold in the same period. Revenue from product software includes global consumer language-learning revenue associated with perpetual
product software licenses in addition to service revenues
28