Rosetta Stone 2014 Annual Report Download - page 63
Download and view the complete annual report
Please find page 63 of the 2014 Rosetta Stone annual report below. You can navigate through the pages in the report by either clicking on the pages listed below, or by using the keyword search tool below to find specific information within the annual report.-
 1
1 -
2
-
3
-
4
-
5
-
6
-
7
-
8
-
9
-
10
-
11
-
12
-
13
-
14
-
15
-
16
-
17
-
18
-
19
-
20
-
21
-
22
-
23
-
24
-
25
-
26
-
27
-
28
-
29
-
30
-
31
-
32
-
33
-
34
-
35
-
36
-
37
-
38
-
39
-
40
-
41
-
42
-
43
-
44
-
45
-
46
-
47
-
48
-
49
-
50
-
51
-
52
-
 53
53 -
 54
54 -
 55
55 -
 56
56 -
 57
57 -
 58
58 -
 59
59 -
 60
60 -
 61
61 -
 62
62 -
 63
63 -
 64
64 -
 65
65 -
 66
66 -
 67
67 -
 68
68 -
 69
69 -
 70
70 -
 71
71 -
 72
72 -
 73
73 -
74
-
75
-
76
-
77
-
78
-
79
-
80
-
81
-
82
-
83
-
84
-
85
-
86
-
87
-
88
-
89
-
90
-
91
-
92
-
93
-
94
-
95
-
96
-
97
-
98
-
99
-
100
-
101
-
102
-
103
-
104
-
105
-
106
-
107
-
108
-
109
-
110
-
111
-
112
-
113
-
114
-
115
-
116
-
117
-
118
-
119
-
120
-
121
-
122
-
123
-
124
-
125
-
126
-
127
-
128
-
129
-
130
-
131
-
132
-
133
-
134
-
135
-
136
-
137
-
138
-
139
-
140
-
141
-
142
-
143
-
144
-
145
-
146
-
147
-
148
-
149
-
150
-
151
-
152
-
153
-
154
-
155
-
156
-
157
-
158
-
159
-
160
-
161
-
162
-
163
-
164
-
165
-
166
-
167
-
168
-
169
-
170
-
171
-
172
-
173
-
174
-
175
-
176
-
177
-
178
-
179
-
180
-
181
-
182
-
183
-
184
-
185
-
186
-
187
-
188
-
189
-
190
-
191
-
192
-
193
-
194
-
195
-
196
-
197
-
198
-
199
-
200
-
201
-
202
-
203
-
204
-
205
-
206
-
207
-
208
-
209
-
210
 |
 |

Table of Contents
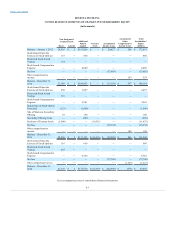
Balance—January 1, 2012
20,936
$ 2
$ 151,824
$ —
$ 20,827
$ 298
$ 172,951
Stock Issued Upon the
Exercise of Stock Options
118
—
860
—
—
—
860
Restricted Stock Award
Vesting
134
—
—
—
—
—
—
Stock-based Compensation
Expense
—
—
8,009
—
—
—
8,009
Net loss
—
—
—
—
(33,985)
—
(33,985)
Other comprehensive
income
—
—
—
—
—
359
359
Balance—December 31,
2012
21,188
$ 2
$ 160,693
$ —
$ (13,158)
$ 657
$ 148,194
Stock Issued Upon the
Exercise of Stock Options
550
—
2,457
—
—
—
2,457
Restricted Stock Award
Vesting
301
—
—
—
—
—
—
Stock-based Compensation
Expense
—
—
9,241
—
—
—
9,241
Repurchase of Stock Option
Exercised
(123)
—
(1,040)
—
—
—
(1,040)
Sale of Shares in Secondary
Offering
10
—
160
—
—
—
160
Secondary Offering Costs
—
—
(388)
—
—
—
(388)
Purchase of Treasury Stock
(1,000)
—
—
(11,435)
—
—
(11,435)
Net loss
—
—
—
—
(16,134)
—
(16,134)
Other comprehensive
income
—
—
—
—
—
188
188
Balance—December 31,
2013
20,926
$ 2
$ 171,123
$ (11,435)
$ (29,292)
$ 845
$ 131,243
Stock Issued Upon the
Exercise of Stock Options
116
—
669
—
—
—
669
Restricted Stock Award
Vesting
287
—
—
—
—
—
—
Stock-based Compensation
Expense
—
—
6,762
—
—
—
6,762
Net loss
—
—
—
—
(73,706)
—
(73,706)
Other comprehensive loss
—
—
—
—
—
(1,523)
(1,523)
Balance—December 31,
2014
21,329
$ 2
$ 178,554
$ (11,435)
$ (102,998)
$ (678)
$ 63,445
See accompanying notes to consolidated financial statements
F-7