Rosetta Stone 2014 Annual Report Download - page 42
Download and view the complete annual report
Please find page 42 of the 2014 Rosetta Stone annual report below. You can navigate through the pages in the report by either clicking on the pages listed below, or by using the keyword search tool below to find specific information within the annual report.-
 1
1 -
2
-
3
-
4
-
5
-
6
-
7
-
8
-
9
-
10
-
11
-
12
-
13
-
14
-
15
-
16
-
17
-
18
-
19
-
20
-
21
-
22
-
23
-
24
-
25
-
26
-
27
-
28
-
29
-
30
-
31
-
 32
32 -
 33
33 -
 34
34 -
 35
35 -
 36
36 -
 37
37 -
 38
38 -
 39
39 -
 40
40 -
 41
41 -
 42
42 -
 43
43 -
 44
44 -
 45
45 -
 46
46 -
 47
47 -
 48
48 -
 49
49 -
 50
50 -
 51
51 -
 52
52 -
53
-
54
-
55
-
56
-
57
-
58
-
59
-
60
-
61
-
62
-
63
-
64
-
65
-
66
-
67
-
68
-
69
-
70
-
71
-
72
-
73
-
74
-
75
-
76
-
77
-
78
-
79
-
80
-
81
-
82
-
83
-
84
-
85
-
86
-
87
-
88
-
89
-
90
-
91
-
92
-
93
-
94
-
95
-
96
-
97
-
98
-
99
-
100
-
101
-
102
-
103
-
104
-
105
-
106
-
107
-
108
-
109
-
110
-
111
-
112
-
113
-
114
-
115
-
116
-
117
-
118
-
119
-
120
-
121
-
122
-
123
-
124
-
125
-
126
-
127
-
128
-
129
-
130
-
131
-
132
-
133
-
134
-
135
-
136
-
137
-
138
-
139
-
140
-
141
-
142
-
143
-
144
-
145
-
146
-
147
-
148
-
149
-
150
-
151
-
152
-
153
-
154
-
155
-
156
-
157
-
158
-
159
-
160
-
161
-
162
-
163
-
164
-
165
-
166
-
167
-
168
-
169
-
170
-
171
-
172
-
173
-
174
-
175
-
176
-
177
-
178
-
179
-
180
-
181
-
182
-
183
-
184
-
185
-
186
-
187
-
188
-
189
-
190
-
191
-
192
-
193
-
194
-
195
-
196
-
197
-
198
-
199
-
200
-
201
-
202
-
203
-
204
-
205
-
206
-
207
-
208
-
209
-
210
 |
 |

Table of Contents
Global Enterprise & Education revenue increased $24.5 million, or 41%, from $60.2 million for the year ended December 31, 2013 to $84.7 million for
the year ended December 31, 2014. Global Enterprise & Education language revenue increased $9.9 million, $3.7 million, $1.4 million, and $1.2 million in
France, the U.S., Germany, and the UK, respectively, primarily due to the sales of learning solutions acquired in 2014. Global Enterprise & Education literacy
revenue increased $8.7 million from Lexia, which was acquired on August 1, 2013. Global Enterprise & Education bookings increased $36.9 million to
$113.2 million for the year ended December 31, 2014 from $76.3 million for the year ended December 31, 2013. Global Enterprise & Education literacy
bookings contributed $14.8 million of the increase due to the acquisition of Lexia. Global Enterprise & Education language bookings increased $7.6 million
in the U.S. and $14.5 million internationally. The increase in the U.S. includes a $3.0 million, 5-year contract with a K-12 customer which includes a blended
Rosetta Stone Foundations and Rosetta Stone Advantage language-learning solution. We have seen a decline in renewal rates from existing Global
Enterprise & Education language customers while Global Enterprise & Education language bookings are increasing, primarily due to the sales of multi-year
deals. With Global Enterprise & Education language bookings increasing, we expect to see an increase in bookings from new customers, which has a higher
cost of acquisition when compared to the renewal of an existing customer.
Revenue by Product Revenue and Subscription and Service Revenue
We categorize and report our revenue in two categories—product revenue and subscription and service revenue. Product revenue includes revenues
allocated to our perpetual language-learning product software, revenues from the sale of audio practice products, and sales of certain mobile applications.
Subscription and service revenue includes web-based software subscriptions, online services for our conversational coaching and language-learning
community access, as well as revenues from professional services. Subscription and service revenues are typically deferred at the time of sale and then
recognized ratably over the subscription or service period. We bundle our perpetual product software with short-term online services. As a result, we typically
defer 10%-35% of the revenue of each of these bundled sales. We recognize the deferred revenue over the term of the service period
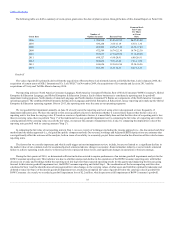
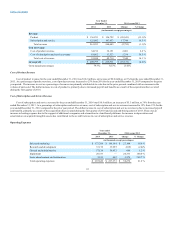
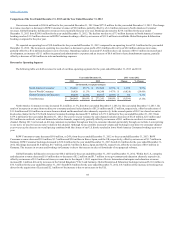
The following table sets forth revenue for products and subscription and services for the years ended December 31, 2014 and 2013:
Product revenue
$ 136,251
52.0%
$ 156,792
59.2%
$ (20,541)
(13.1)%
Subscription and service revenue
125,602
48.0%
107,853
40.8%
17,749
16.5 %
Total revenue
$ 261,853
100.0%
$ 264,645
100.0%
$ (2,792)
(1.1)%
Product Revenue
Product revenue decreased $20.5 million, or 13%, to $136.3 million during the year ended December 31, 2014 from $156.8 million during the year
ended December 31, 2013. Product revenue primarily decreased $11.6 million, $6.2 million and $3.7 million in the global retail, direct-to-consumer, and
kiosk sales channels, respectively. This was partially offset by an increase of $1.8 million in the corporate sales channel. The decrease in product revenue is
driven by lower prices on our Rosetta Stone language-learning product software bundle driven by promotional pricing in our North America Consumer
segment, increased levels of daily deals, and a shift in our sales channel mix.
Subscription and Service Revenue
Subscription and service revenue increased $17.7 million, or 16%, to $125.6 million for the year ended December 31, 2014. The increase in
subscription and service revenues was due to increases of $13.9 million in the education sales channel, $9.0 million in the corporate channel, and $2.6
million related to Fit Brains. These increases were partially offset by decreases of $4.8 million, $2.6 million and $1.5 million in consumer service revenues for
the direct-to-consumer, global retail, and kiosk sales channels, respectively.
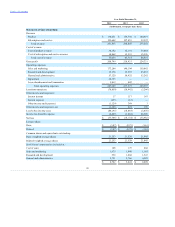
The following table sets forth cost of product revenue and subscription and service revenue, as well as gross profit for the years ended December 31,
2014 and 2013:
40