Rosetta Stone 2014 Annual Report Download - page 46
Download and view the complete annual report
Please find page 46 of the 2014 Rosetta Stone annual report below. You can navigate through the pages in the report by either clicking on the pages listed below, or by using the keyword search tool below to find specific information within the annual report.-
 1
1 -
2
-
3
-
4
-
5
-
6
-
7
-
8
-
9
-
10
-
11
-
12
-
13
-
14
-
15
-
16
-
17
-
18
-
19
-
20
-
21
-
22
-
23
-
24
-
25
-
26
-
27
-
28
-
29
-
30
-
31
-
32
-
33
-
34
-
35
-
 36
36 -
 37
37 -
 38
38 -
 39
39 -
 40
40 -
 41
41 -
 42
42 -
 43
43 -
 44
44 -
 45
45 -
 46
46 -
 47
47 -
 48
48 -
 49
49 -
 50
50 -
 51
51 -
 52
52 -
 53
53 -
 54
54 -
 55
55 -
 56
56 -
57
-
58
-
59
-
60
-
61
-
62
-
63
-
64
-
65
-
66
-
67
-
68
-
69
-
70
-
71
-
72
-
73
-
74
-
75
-
76
-
77
-
78
-
79
-
80
-
81
-
82
-
83
-
84
-
85
-
86
-
87
-
88
-
89
-
90
-
91
-
92
-
93
-
94
-
95
-
96
-
97
-
98
-
99
-
100
-
101
-
102
-
103
-
104
-
105
-
106
-
107
-
108
-
109
-
110
-
111
-
112
-
113
-
114
-
115
-
116
-
117
-
118
-
119
-
120
-
121
-
122
-
123
-
124
-
125
-
126
-
127
-
128
-
129
-
130
-
131
-
132
-
133
-
134
-
135
-
136
-
137
-
138
-
139
-
140
-
141
-
142
-
143
-
144
-
145
-
146
-
147
-
148
-
149
-
150
-
151
-
152
-
153
-
154
-
155
-
156
-
157
-
158
-
159
-
160
-
161
-
162
-
163
-
164
-
165
-
166
-
167
-
168
-
169
-
170
-
171
-
172
-
173
-
174
-
175
-
176
-
177
-
178
-
179
-
180
-
181
-
182
-
183
-
184
-
185
-
186
-
187
-
188
-
189
-
190
-
191
-
192
-
193
-
194
-
195
-
196
-
197
-
198
-
199
-
200
-
201
-
202
-
203
-
204
-
205
-
206
-
207
-
208
-
209
-
210
 |
 |

Table of Contents
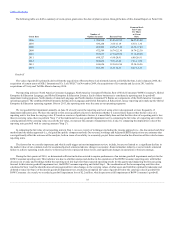
Our revenue decreased to $264.6 million for the year ended December 31, 2013 from $273.2 million for the year ended December 31, 2012. The change
in revenue was due to a decrease in ROW Consumer revenues of $9.8 million, partially offset by a $1.2 million increase in North American Consumer
revenues. Global Enterprise & Education revenues were essentially flat year over year. Bookings decreased to $278.1 million for the year ended
December 31, 2013 from $284.8 million for the year ended December 31, 2012. The decline was due to a $7.3 million decrease in North America Consumer
bookings and an $11.2 million decrease in ROW Consumer bookings, offset by an increase of $11.9 million in worldwide Global Enterprise & Education
bookings compared to the prior year.
We reported an operating loss of $18.4 million for the year ended December 31, 2013 compared to an operating loss of $5.3 million for the year ended
December 31, 2012. The increase in operating loss was due to a decrease in gross profit of $5.4 million, driven by an $8.6 million decrease in revenue,
partially offset by a $3.2 million decrease in cost of revenue. Operating expenses increased $7.8 million due to an increase of $10.5 million in research and
development, an increase of $1.1 million in general and administrative expenses and an increase of $0.8 million in lease abandonment expense, partially
offset by a decrease of $4.8 million in sales and marketing expenses.
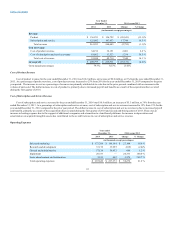
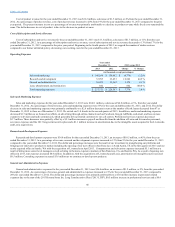
The following table sets forth revenue for each of our three operating segments for the years ended December 31, 2013 and 2012:
North America Consumer
$ 174,016
65.7%
$ 172,826
63.3%
$ 1,190
0.7 %
Rest of World Consumer
30,420
11.5%
40,248
14.7%
$ (9,828)
(24.4)%
Global Enterprise & Education
60,209
22.8%
60,167
22.0%
$ 42
0.1 %
Total Revenue
$ 264,645
100.0%
$ 273,241
100.0%
$ (8,596)
(3.1)%
North America Consumer revenue increased $1.2 million, or 1%, from the year ended December 31, 2012 to the year ended December 31, 2013, the
result of increases in revenue from our direct-to-consumer and retail sales channels of $12.6 million and $1.3 million, respectively, offset by reductions of
$11.8 million and $1.0 million in revenue from our kiosk and homeschool sales channels, respectively. In the second quarter of 2013 we closed our entire
kiosk sales channel in the U.S. North America Consumer bookings decreased $7.3 million to $171.9 million for the year ended December 31, 2013 from
$179.2 million for the year ended December 31, 2012. The year-over-year variance by sales channel includes decreases of $12.0 million, $2.5 million and
$0.9 million in our kiosk, retail and homeschool sales channels, respectively, partially offset by an increase of $8.1 million in our direct-to-consumer
channel. During 2013 we focused on driving customers to purchase through our direct-to-consumer channel, particularly through our website. Lower pricing
is one tactic we used to increase sales volume in this channel. Although we successfully increased volume and bookings in our direct-to-consumer channel
year-over-year, the decrease in overall pricing combined with the closure of our U.S. kiosks resulted in lower North America Consumer bookings year-over-
year.
ROW Consumer revenue decreased $9.8 million, or 24%, from the year ended December 31, 2012 to the year ended December 31, 2013. ROW
Consumer revenue decreased $5.8 million, $3.7 million and $2.0 million in Korea, Japan, and the UK, respectively, offset by an increase of $1.7 million in
Germany. ROW Consumer bookings decreased to $30.0 million for the year ended December 31, 2013 from $41.2 million for the year ended December 31,
2012. Bookings decreased $5.0 million, $4.7 million, and $2.3 million in Korea, Japan and the UK, respectively, offset by an increase of $0.6 million in
Germany. The increase in revenue and bookings in Germany is due to the increase in sales of downloads of our perpetual software.
Global Enterprise & Education revenue was $60.2 million for the years ended December 31, 2013 and December 31, 2012. Within the U.S., enterprise
and education revenue decreased $1.6 million due to decreases of $2.2 million and $1.7 million in our government and education channels, respectively,
offset by an increase of $1.2 million in literacy revenue due to the August 1, 2013 acquisition of Lexia. International enterprise and education revenues
increased $1.6 million driven by increases in the United Kingdom ("U.K.") and Germany. Global Enterprise & Education bookings increased $11.8 million to
$76.3 million for the year ended December 31, 2013 from $64.4 million for the year ended December 31, 2012. $8.3 million of the increase in bookings was
driven by the acquisition of Lexia and $2.1 million of the increase is due to an increase in the U.K.
44