Rosetta Stone 2014 Annual Report Download - page 41
Download and view the complete annual report
Please find page 41 of the 2014 Rosetta Stone annual report below. You can navigate through the pages in the report by either clicking on the pages listed below, or by using the keyword search tool below to find specific information within the annual report.-
 1
1 -
2
-
3
-
4
-
5
-
6
-
7
-
8
-
9
-
10
-
11
-
12
-
13
-
14
-
15
-
16
-
17
-
18
-
19
-
20
-
21
-
22
-
23
-
24
-
25
-
26
-
27
-
28
-
29
-
30
-
 31
31 -
 32
32 -
 33
33 -
 34
34 -
 35
35 -
 36
36 -
 37
37 -
 38
38 -
 39
39 -
 40
40 -
 41
41 -
 42
42 -
 43
43 -
 44
44 -
 45
45 -
 46
46 -
 47
47 -
 48
48 -
 49
49 -
 50
50 -
 51
51 -
52
-
53
-
54
-
55
-
56
-
57
-
58
-
59
-
60
-
61
-
62
-
63
-
64
-
65
-
66
-
67
-
68
-
69
-
70
-
71
-
72
-
73
-
74
-
75
-
76
-
77
-
78
-
79
-
80
-
81
-
82
-
83
-
84
-
85
-
86
-
87
-
88
-
89
-
90
-
91
-
92
-
93
-
94
-
95
-
96
-
97
-
98
-
99
-
100
-
101
-
102
-
103
-
104
-
105
-
106
-
107
-
108
-
109
-
110
-
111
-
112
-
113
-
114
-
115
-
116
-
117
-
118
-
119
-
120
-
121
-
122
-
123
-
124
-
125
-
126
-
127
-
128
-
129
-
130
-
131
-
132
-
133
-
134
-
135
-
136
-
137
-
138
-
139
-
140
-
141
-
142
-
143
-
144
-
145
-
146
-
147
-
148
-
149
-
150
-
151
-
152
-
153
-
154
-
155
-
156
-
157
-
158
-
159
-
160
-
161
-
162
-
163
-
164
-
165
-
166
-
167
-
168
-
169
-
170
-
171
-
172
-
173
-
174
-
175
-
176
-
177
-
178
-
179
-
180
-
181
-
182
-
183
-
184
-
185
-
186
-
187
-
188
-
189
-
190
-
191
-
192
-
193
-
194
-
195
-
196
-
197
-
198
-
199
-
200
-
201
-
202
-
203
-
204
-
205
-
206
-
207
-
208
-
209
-
210
 |
 |

Table of Contents
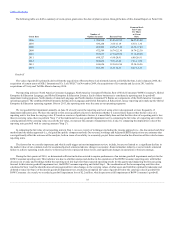
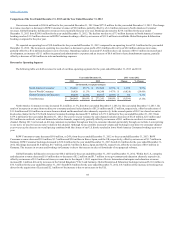
Our total revenue decreased to $261.9 million for the year ended December 31, 2014 from $264.6 million for the year ended December 31, 2013. The
change in total revenue is due to decreases in North America Consumer revenues of $21.0 million and ROW Consumer revenues of $6.3 million, partially
offset by an increase in Global Enterprise & Education revenues of $24.5 million. Bookings increased to $309.0 million for the year ended December 31,
2014 from $278.1 million for the year ended December 31, 2013. The increase was due to increases of $36.9 million and $1.2 million in worldwide Global
Enterprise & Education bookings and North America Consumer, respectively, offset by a decrease in ROW Consumer bookings of $7.2 million compared to
the prior year.
We reported an operating loss of $78.9 million for the year ended December 31, 2014 compared to an operating loss of $18.4 million for the year ended
December 31, 2013. The increase in operating loss was due to a decrease in gross profit of $10.1 million, driven by a $2.8 million decrease in revenue and a
$7.3 million increase in cost of revenue. Operating expenses increased $50.3 million due to increases of $27.1 million in sales and marketing, $0.7 million in
general and administrative, $20.3 million in impairment expenses, and $3.0 million in lease abandonment, offset slightly by a decrease of $0.8 million in
research and development expenses.
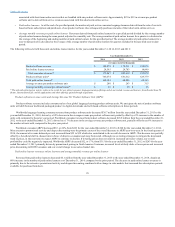
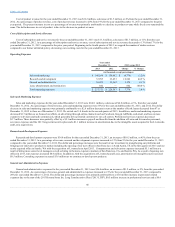
The following table sets forth revenue for each of our three operating segments for the years ended December 31, 2014 and 2013:
North America Consumer
$ 153,003
58.4%
$ 174,016
65.7%
$ (21,013)
(12.1)%
Rest of World Consumer
24,150
9.2%
30,420
11.5%
$ (6,270)
(20.6)%
Global Enterprise & Education
84,700
32.4%
60,209
22.8%
$ 24,491
40.7 %
Total Revenue
$ 261,853
100.0%
$ 264,645
100.0%
$ (2,792)
(1.1)%
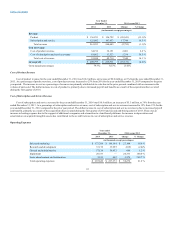
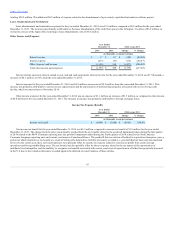
North America Consumer revenue decreased $21.0 million, or 12%, from the year ended December 31, 2013 to the year ended December 31, 2014. This
decrease was due to reductions in revenue from our global retail, direct-to-consumer, kiosk, and home school sales channels of $13.0 million, $6.4 million,
$3.8 million, and $0.7 million, respectively; partially offset by an increase of approximately $2.6 million in revenue from Fit Brains North America
Consumer bookings increased $1.2 million to $173.0 million for the year ended December 31, 2014 from $171.9 million for the year ended December 31,
2013. The variance by sales channel is due to increases of $11.9 million and $5.1 million in our direct-to-consumer sales channel and Fit Brains, respectively,
partially offset by decreases of $12.2 million, $3.1 million, and $0.7 million in our global retail, kiosk, and homeschool sales channels, respectively. The
decrease in our global retail sales channel was due to certain of our larger retail partners significantly reducing inventory levels during 2014, resulting in
fewer units ordered and lower revenue compared to last year. In the second quarter of 2013 we closed our entire kiosk sales channel in the North America
Consumer segment. In recent quarters we have focused on driving customers to purchase through our direct-to-consumer channel, particularly through our
website. Lower pricing is one tactic we used to increase sales volume in this channel. The overall decrease in pricing combined with the closure of our U.S.
kiosks resulted in lower North America Consumer bookings. As a result of our strategic realignment and our focus on the needs of more serious learners, we
plan to stabilize the price of our consumer offerings and expect that this will result in lower unit volumes and overall lower sales.
While direct-to-consumer revenue is down, the direct-to-consumer bookings have increased, primarily due to the late 2013 change in sales models that
increased the subscription periods from short-term subscriptions to 36-month subscriptions, thus increasing the period over which revenue is recognized.
ROW Consumer revenue decreased $6.3 million, or 21%, from the year ended December 31, 2013 to the year ended December 31, 2014. ROW
Consumer revenue decreases were primarily driven by lower revenues of $3.6 million, $2.3 million and $0.8 million in Japan, Korea, and Germany,
respectively, offset by an increase of $0.5 million in revenue from indirect, digital resellers. ROW Consumer bookings decreased to $22.7 million for the year
ended December 31, 2014 from $30.0 million for the year ended December 31, 2013. Bookings decreased primarily due to decreases of $4.5 million and $3.2
million in Japan and Korea, respectively, offset by an increase of $1.0 million in bookings from indirect, digital resellers. In January 2014, we announced
plans to streamline our Japan and Korea operations and use a partner model to continue to serve the Japanese market and have reorganized our Korea
operations to focus more directly on further scaling the Proctor Assisted Learning (“PAL”) sales channel.
39