Rosetta Stone 2014 Annual Report Download - page 32
Download and view the complete annual report
Please find page 32 of the 2014 Rosetta Stone annual report below. You can navigate through the pages in the report by either clicking on the pages listed below, or by using the keyword search tool below to find specific information within the annual report.-
 1
1 -
2
-
3
-
4
-
5
-
6
-
7
-
8
-
9
-
10
-
11
-
12
-
13
-
14
-
15
-
16
-
17
-
18
-
19
-
20
-
21
-
 22
22 -
 23
23 -
 24
24 -
 25
25 -
 26
26 -
 27
27 -
 28
28 -
 29
29 -
 30
30 -
 31
31 -
 32
32 -
 33
33 -
 34
34 -
 35
35 -
 36
36 -
 37
37 -
 38
38 -
 39
39 -
 40
40 -
 41
41 -
 42
42 -
43
-
44
-
45
-
46
-
47
-
48
-
49
-
50
-
51
-
52
-
53
-
54
-
55
-
56
-
57
-
58
-
59
-
60
-
61
-
62
-
63
-
64
-
65
-
66
-
67
-
68
-
69
-
70
-
71
-
72
-
73
-
74
-
75
-
76
-
77
-
78
-
79
-
80
-
81
-
82
-
83
-
84
-
85
-
86
-
87
-
88
-
89
-
90
-
91
-
92
-
93
-
94
-
95
-
96
-
97
-
98
-
99
-
100
-
101
-
102
-
103
-
104
-
105
-
106
-
107
-
108
-
109
-
110
-
111
-
112
-
113
-
114
-
115
-
116
-
117
-
118
-
119
-
120
-
121
-
122
-
123
-
124
-
125
-
126
-
127
-
128
-
129
-
130
-
131
-
132
-
133
-
134
-
135
-
136
-
137
-
138
-
139
-
140
-
141
-
142
-
143
-
144
-
145
-
146
-
147
-
148
-
149
-
150
-
151
-
152
-
153
-
154
-
155
-
156
-
157
-
158
-
159
-
160
-
161
-
162
-
163
-
164
-
165
-
166
-
167
-
168
-
169
-
170
-
171
-
172
-
173
-
174
-
175
-
176
-
177
-
178
-
179
-
180
-
181
-
182
-
183
-
184
-
185
-
186
-
187
-
188
-
189
-
190
-
191
-
192
-
193
-
194
-
195
-
196
-
197
-
198
-
199
-
200
-
201
-
202
-
203
-
204
-
205
-
206
-
207
-
208
-
209
-
210
 |
 |

Table of Contents
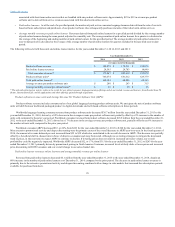
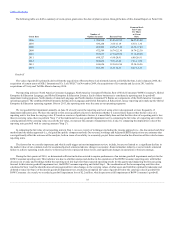
term subscriptions to 36-month subscriptions. These factors have led to the overall decrease in the average monthly revenue per online learner and longer
periods over which subscription revenue is recognized. Revenue from paid online learners increased $9.7 million from the year ended December 31, 2012 to
the year ended December 31, 2013, driven by a 38% increase in the number of paid online learners as of December 31, 2012, compared to the prior period.
This increase was partially offset by a decrease in the average revenue per online learner due to the decrease in paid subscription price points implemented in
September 2013.
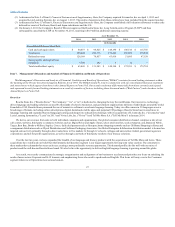
In addition to the unit and learner metrics described above, management also uses bookings to evaluate the overall health of the business and evaluate
performance. Bookings are a non-GAAP financial measure that represent executed sales contracts received that are either recorded immediately as revenue or
as deferred revenue. Bookings are calculated in total and at the operating segment level as revenue plus the change in deferred revenue. Management
believes that bookings provides useful information to investors regarding certain financial and business trends relating to our financial condition and results
of operations.
We derive revenue from sales of language-learning, literacy, and brain fitness solutions. Revenue is presented as product revenue or subscription and
service revenue in our consolidated financial statements. Product revenue primarily consists of revenues from our perpetual language-learning product
software, our audio practice products, and certain mobile applications. Our audio practice products are often combined with our language-learning software
and sold as a solution. Subscription and service revenue consist of sales from web-based software subscriptions, online services, professional services, and
certain mobile applications. Our online services are typically sold in short-term service periods and include dedicated online conversational coaching
services and access to online communities of language learners. Our professional services include training and implementation services.
In the consumer market, our perpetual product software is often bundled with our short-term online conversational coaching and online community
services and sold as a package. Approximately $25 to $39 in revenue per unit is derived from these short-term online services. As a result, we typically defer
10%-35% of the revenue of each of these bundled sales to be recognized over the term of the service period. The content of our perpetual product software
and our web-based language-learning subscription offerings are the same. We offer our customers the ability to choose which format they prefer without
differentiating the learning experience.
We sell our solutions directly and indirectly to individuals, educational institutions, corporations, and government agencies. We distribute our
consumer products predominantly through our direct sales channels, primarily our websites and call centers, which we refer to as our direct-to-consumer
channel. We also distribute our consumer products through select third-party retailers. We sell to enterprise and education organizations primarily through
our direct enterprise and education sales force as well as our network of resellers and organizations typically gain access to our solutions under a web-based
subscription service. For purposes of explaining variances in our revenue, we separately discuss changes in our consumer and enterprise and education sales
channels because the customers and revenue drivers of these channels are different.
Our consumer revenue is affected by seasonal trends associated with the holiday shopping season. As a result, our fourth quarter ended December 31,
2014 accounted for 30% of our annual revenue in 2014. Our enterprise and education revenue is seasonally stronger in the second and third quarters of the
calendar year due to education and government purchasing cycles. We expect these trends to continue.
Cost of product revenue consists of the direct and indirect materials and labor costs to produce and distribute our products. Such costs include
packaging materials, computer headsets, freight, inventory receiving, personnel costs associated with product assembly, third-party royalty fees and
inventory storage, obsolescence and shrinkage. The cost of subscription and service revenue primarily represents costs associated with supporting our web-
based subscription services and online language-learning services, which includes online language conversation coaching, hosting costs and depreciation.
We also include the cost of credit card processing and customer technical support in both cost of product revenue and cost of subscription and service
revenue.
We classify our operating expenses into the following categories: sales and marketing, research and development, general and administrative,
impairment, and lease abandonment and termination.
30