Rosetta Stone 2014 Annual Report Download - page 49
Download and view the complete annual report
Please find page 49 of the 2014 Rosetta Stone annual report below. You can navigate through the pages in the report by either clicking on the pages listed below, or by using the keyword search tool below to find specific information within the annual report.-
 1
1 -
2
-
3
-
4
-
5
-
6
-
7
-
8
-
9
-
10
-
11
-
12
-
13
-
14
-
15
-
16
-
17
-
18
-
19
-
20
-
21
-
22
-
23
-
24
-
25
-
26
-
27
-
28
-
29
-
30
-
31
-
32
-
33
-
34
-
35
-
36
-
37
-
38
-
 39
39 -
 40
40 -
 41
41 -
 42
42 -
 43
43 -
 44
44 -
 45
45 -
 46
46 -
 47
47 -
 48
48 -
 49
49 -
 50
50 -
 51
51 -
 52
52 -
 53
53 -
 54
54 -
 55
55 -
 56
56 -
 57
57 -
 58
58 -
 59
59 -
60
-
61
-
62
-
63
-
64
-
65
-
66
-
67
-
68
-
69
-
70
-
71
-
72
-
73
-
74
-
75
-
76
-
77
-
78
-
79
-
80
-
81
-
82
-
83
-
84
-
85
-
86
-
87
-
88
-
89
-
90
-
91
-
92
-
93
-
94
-
95
-
96
-
97
-
98
-
99
-
100
-
101
-
102
-
103
-
104
-
105
-
106
-
107
-
108
-
109
-
110
-
111
-
112
-
113
-
114
-
115
-
116
-
117
-
118
-
119
-
120
-
121
-
122
-
123
-
124
-
125
-
126
-
127
-
128
-
129
-
130
-
131
-
132
-
133
-
134
-
135
-
136
-
137
-
138
-
139
-
140
-
141
-
142
-
143
-
144
-
145
-
146
-
147
-
148
-
149
-
150
-
151
-
152
-
153
-
154
-
155
-
156
-
157
-
158
-
159
-
160
-
161
-
162
-
163
-
164
-
165
-
166
-
167
-
168
-
169
-
170
-
171
-
172
-
173
-
174
-
175
-
176
-
177
-
178
-
179
-
180
-
181
-
182
-
183
-
184
-
185
-
186
-
187
-
188
-
189
-
190
-
191
-
192
-
193
-
194
-
195
-
196
-
197
-
198
-
199
-
200
-
201
-
202
-
203
-
204
-
205
-
206
-
207
-
208
-
209
-
210
 |
 |

Table of Contents
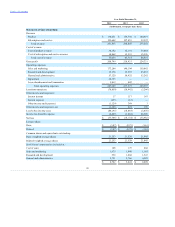
million increase in rent expense. These increases were partially offset by a $0.4 million increase in bad debt recoveries and $0.4 million decrease in
depreciation expense related to certain assets being fully depreciated early in the second quarter of 2012.
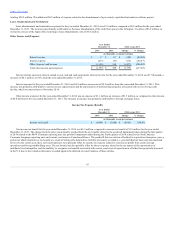
Lease Abandonment and Termination
In March 2013, we exited a portion of our facility in Japan as a result of excess office space. Accrued exit costs of $0.8 million associated with the
partial abandonment were charged to lease abandonment expenses in the first quarter of 2013.
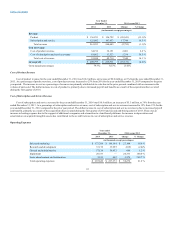
Interest and Other Income (Expense)
Interest Income
$ 117
$ 187
$ (70)
(37.4)%
Interest Expense
(61)
—
(61)
n/a
Other Income (Expense)
368
3
365
12,166.7 %
Total other income (expense)
$ 424
$ 190
$ 234
123.2 %
Interest income represents interest earned on our cash and cash equivalents. Interest income for the year ended December 31, 2013 was $117,000, a
decrease of $70,000, or 37%, from the year ended December 31, 2012.
Interest expense for the year ended December 31, 2013 was $61,000, an increase of $61,000, or 100% from the year ended December 31, 2012. This
increase was primarily attributable to interest on our capital leases.
Other income for the year ended December 31, 2013 was $368,000, an increase of $365,000, as compared to other income of $3,000 for the year ended
December 31, 2012. The increase was primarily due to a donation of software to a children's foundation in Korea and an increase in legal settlements in
connection with our anti-piracy enforcement efforts, partially offset by foreign exchange losses.
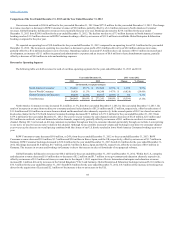
Income tax (benefit) expense
$ (1,884)
$ 28,909
$ (30,793)
(106.5)%
Our income tax benefit for the year ended December 31, 2013 was $1.9 million, compared to income tax expense of $28.9 million for the year ended
December 31, 2012. The change primarily resulted from partial valuation allowance releases of $5.4 million related to the Livemocha and Lexia acquisitions
in 2013 and a $26.0 million non-cash charge associated with establishing a valuation allowance for our U.S. and certain foreign operations in 2012.
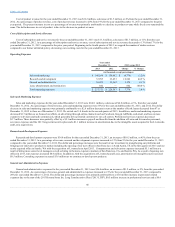
Cash, cash equivalents, and short-term investments were $64.7 million and $98.8 million as of December 31, 2014 and 2013, respectively. Our primary
operating cash requirements include the payment of salaries, incentive compensation, employee benefits and other personnel related costs, as well as direct
advertising expenses, costs of office facilities and costs of information technology systems. We fund these requirements through cash flow from our
operations.
We expect that our future growth may continue to require additional working capital. Our future capital requirements will depend on many factors,
including development of new products, market acceptance of our products, the levels of advertising and promotion required to launch additional products
and improve our competitive position in the marketplace, the expansion of our sales, support and marketing organizations, the establishment of additional
offices in the U.S. and worldwide and building the infrastructure necessary to support our growth, the response of competitors to our products and services,
and our relationships with suppliers and clients.
On October 28, 2014, we entered into a $25 million revolving credit Loan and Security Agreement with Silicon Valley Bank. The revolving credit
facility has a term of three years during which we may borrow and re-pay loan amounts and re-borrow the loan amounts subject to customary borrowing
conditions. As of the date of this filing, no borrowings have been
47