Rosetta Stone 2013 Annual Report Download - page 79
Download and view the complete annual report
Please find page 79 of the 2013 Rosetta Stone annual report below. You can navigate through the pages in the report by either clicking on the pages listed below, or by using the keyword search tool below to find specific information within the annual report.-
 1
1 -
2
-
3
-
4
-
5
-
6
-
7
-
8
-
9
-
10
-
11
-
12
-
13
-
14
-
15
-
16
-
17
-
18
-
19
-
20
-
21
-
22
-
23
-
24
-
25
-
26
-
27
-
28
-
29
-
30
-
31
-
32
-
33
-
34
-
35
-
36
-
37
-
38
-
39
-
40
-
41
-
42
-
43
-
44
-
45
-
46
-
47
-
48
-
49
-
50
-
51
-
52
-
53
-
54
-
55
-
56
-
57
-
58
-
59
-
60
-
61
-
62
-
63
-
64
-
65
-
66
-
67
-
68
-
 69
69 -
 70
70 -
 71
71 -
 72
72 -
 73
73 -
 74
74 -
 75
75 -
 76
76 -
 77
77 -
 78
78 -
 79
79 -
 80
80 -
 81
81 -
 82
82 -
 83
83 -
 84
84 -
 85
85 -
 86
86 -
 87
87 -
 88
88 -
 89
89 -
90
-
91
-
92
-
93
-
94
-
95
-
96
-
97
-
98
-
99
-
100
-
101
-
102
-
103
-
104
-
105
-
106
-
107
-
108
-
109
-
110
-
111
-
112
-
113
-
114
-
115
 |
 |

Table of Contents
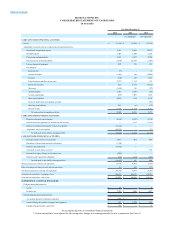
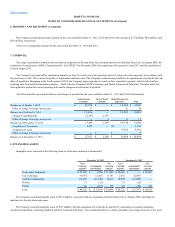
Net loss
$(16,134)
$ (33,985)
$(19,650)
Weighted average number of common shares:
Basic
21,528
21,045
20,773
Diluted
21,528
21,045
20,773
Loss per common share:
Basic
$(0.75)
$ (1.61)
$ (0.95)
Diluted
$(0.75)
$ (1.61)
$ (0.95)
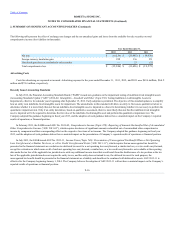
Share-based awards to purchase approximately 1.3 million, 1.4 million and1.0 million shares of common stock that had an exercise price in excess of the
average market price of the common stock during the years ended December 31, 2013, 2012 and 2011, respectively, were not included in the calculation of
diluted earnings per share because they were anti-dilutive.
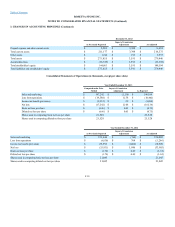
Comprehensive income (loss) consists of net income (loss) and other comprehensive income (loss). Other comprehensive income (loss) refers to
revenues, expenses, gains, and losses that are not included in net income (loss), but rather are recorded directly in stockholders' equity. For the years ended
December 31, 2013, 2012 and 2011, the Company's comprehensive income (loss) consisted of net income (loss), foreign currency translation gains (losses)
and the net unrealized gains (losses) on available-for-sale securities.
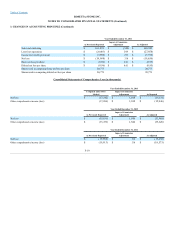
Components of accumulated other comprehensive income (loss) as of December 31, 2013 are as follows (in thousands):
Balance at beginning of period
$657 $657
Other comprehensive income before reclassifications
188 188
Amounts reclassified from accumulated other comprehensive income
— —
Net current period other comprehensive income, net
188 188
Accumulated other comprehensive loss
$ 845 $ 845
During the year ended December 31, 2013, there were no reclassifications out of accumulated other comprehensive income.
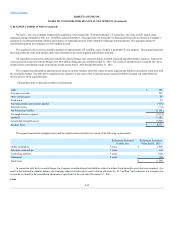
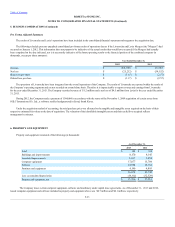
The functional currency of the Company's foreign subsidiaries is their local currency. Accordingly, assets and liabilities of the foreign subsidiaries are
translated into U.S. dollars at exchange rates in effect on the balance sheet date. Income and expense items are translated at average rates for the period.
Translation adjustments are recorded as a component of other comprehensive income (loss) in stockholders' equity.
Cash flows of consolidated foreign subsidiaries, whose functional currency is the local currency, are translated to U.S. dollars using average exchange
rates for the period. The Company reports the effect of exchange rate changes on cash balances held in foreign currencies as a separate item in the reconciliation
of the changes in cash and cash equivalents during the period.
F-15