Rosetta Stone 2013 Annual Report Download - page 101
Download and view the complete annual report
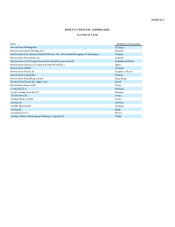
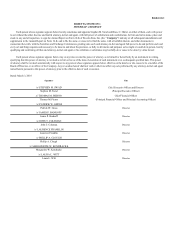
Please find page 101 of the 2013 Rosetta Stone annual report below. You can navigate through the pages in the report by either clicking on the pages listed below, or by using the keyword search tool below to find specific information within the annual report.-
 1
1 -
2
-
3
-
4
-
5
-
6
-
7
-
8
-
9
-
10
-
11
-
12
-
13
-
14
-
15
-
16
-
17
-
18
-
19
-
20
-
21
-
22
-
23
-
24
-
25
-
26
-
27
-
28
-
29
-
30
-
31
-
32
-
33
-
34
-
35
-
36
-
37
-
38
-
39
-
40
-
41
-
42
-
43
-
44
-
45
-
46
-
47
-
48
-
49
-
50
-
51
-
52
-
53
-
54
-
55
-
56
-
57
-
58
-
59
-
60
-
61
-
62
-
63
-
64
-
65
-
66
-
67
-
68
-
69
-
70
-
71
-
72
-
73
-
74
-
75
-
76
-
77
-
78
-
79
-
80
-
81
-
82
-
83
-
84
-
85
-
86
-
87
-
88
-
89
-
90
-
 91
91 -
 92
92 -
 93
93 -
 94
94 -
 95
95 -
 96
96 -
 97
97 -
 98
98 -
 99
99 -
 100
100 -
 101
101 -
 102
102 -
 103
103 -
 104
104 -
 105
105 -
 106
106 -
 107
107 -
 108
108 -
 109
109 -
 110
110 -
 111
111 -
112
-
113
-
114
-
115
 |
 |

Table of Contents
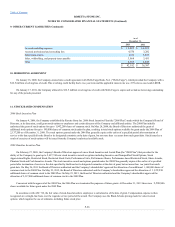
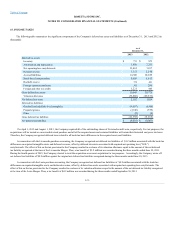
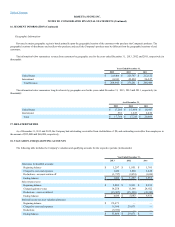
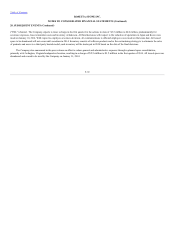
No provision was made in 2013 for U.S. income taxes on undistributed earnings of the foreign subsidiaries as it is the Company's intention to utilize
those earnings in the foreign operations for an indefinite period of time or to repatriate such earnings only when it is tax effective to do so.
The Company made income tax payments of $3.3 million, $4.0 million, and $1.7 million in 2013, 2012 and 2011, respectively.
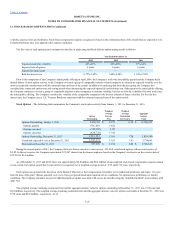
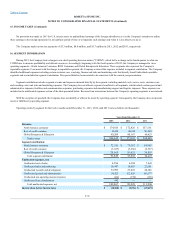
During 2012, the Company had a change in our chief operating decision maker ("CODM"), which led to a change in the fourth quarter to what our
CODM uses to measure profitability and allocate resources. Accordingly, beginning with the fourth quarter of 2012, the Company is managed in three
operating segments—North America Consumer, ROW Consumer and Global Enterprise & Education. These segments also represent the Company's
reportable segments. Concurrent with the change in reportable segments, the Company reviewed the expenses included in segment contribution. The Company
identified additional expenses including certain customer care, coaching, finance and sales and marketing costs that directly benefit individual reportable
segments and are included in segment contribution. Prior period data has been restated to be consistent with the current year presentation.
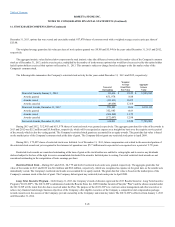
Segment contribution includes segment revenue and expenses incurred directly by the segment, including material costs, service costs, customer care
and coaching costs, and sales and marketing expenses. The Company does not allocate expenses beneficial to all segments, which include certain general and
administrative expenses, facilities and communication expenses, purchasing expenses and manufacturing support and logistic expenses. These expenses are
included in the unallocated expenses section of the table presented below. Revenue from transactions between the Company's operating segments is not material.
With the exception of goodwill, the Company does not identify or allocate its assets by operating segment. Consequently, the Company does not present
assets or liabilities by operating segment.
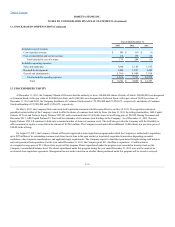
Operating results by segment for the twelve months ended December 31, 2013, 2012, and 2011 were as follows (in thousands):
North America consumer
$ 174,016
$172,826
$157,561
Rest of world consumer
30,420
40,248
50,465
Global Enterprise & Education
60,209
60,167
60,423
Total revenue
$264,645
$273,241
$268,449
North America consumer
$72,511
$70,767
$54,985
Rest of world consumer
(1,627)
(3,536)
(5,317)
Global Enterprise & Education
20,965
26,621
34,819
Total segment contribution
91,849
93,852
84,487
Unallocated cost of sales
4,586
6,104
7,042
Unallocated sales and marketing
16,447
16,633
22,581
Unallocated research and development
33,993
23,455
24,145
Unallocated general and administrative
54,423
52,926
58,577
Unallocated non-operating income/(expense)
(424)
(190)
(439)
Unallocated lease abandonment
842
—
—
Total unallocated expenses, net
109,867
98,928
111,906
F-36