Rosetta Stone 2013 Annual Report Download - page 102
Download and view the complete annual report
Please find page 102 of the 2013 Rosetta Stone annual report below. You can navigate through the pages in the report by either clicking on the pages listed below, or by using the keyword search tool below to find specific information within the annual report.-
 1
1 -
2
-
3
-
4
-
5
-
6
-
7
-
8
-
9
-
10
-
11
-
12
-
13
-
14
-
15
-
16
-
17
-
18
-
19
-
20
-
21
-
22
-
23
-
24
-
25
-
26
-
27
-
28
-
29
-
30
-
31
-
32
-
33
-
34
-
35
-
36
-
37
-
38
-
39
-
40
-
41
-
42
-
43
-
44
-
45
-
46
-
47
-
48
-
49
-
50
-
51
-
52
-
53
-
54
-
55
-
56
-
57
-
58
-
59
-
60
-
61
-
62
-
63
-
64
-
65
-
66
-
67
-
68
-
69
-
70
-
71
-
72
-
73
-
74
-
75
-
76
-
77
-
78
-
79
-
80
-
81
-
82
-
83
-
84
-
85
-
86
-
87
-
88
-
89
-
90
-
91
-
 92
92 -
 93
93 -
 94
94 -
 95
95 -
 96
96 -
 97
97 -
 98
98 -
 99
99 -
 100
100 -
 101
101 -
 102
102 -
 103
103 -
 104
104 -
 105
105 -
 106
106 -
 107
107 -
 108
108 -
 109
109 -
 110
110 -
 111
111 -
 112
112 -
113
-
114
-
115
 |
 |

Table of Contents
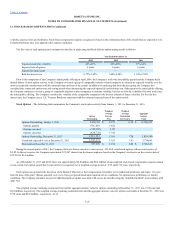
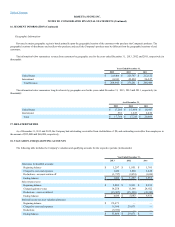
Revenue by major geographic region is based primarily upon the geographic location of the customers who purchase the Company's products. The
geographic locations of distributors and resellers who purchase and resell the Company's products may be different from the geographic locations of end
customers.
The information below summarizes revenue from customers by geographic area for the years ended December 31, 2013, 2012 and 2011, respectively (in
thousands):
United States
$223,404
$223,747
$212,122
International
41,241
49,494
56,327
Total Revenue
$264,645
$273,241
$268,449
The information below summarizes long-lived assets by geographic area for the years ended December 31, 2013, 2012 and 2011, respectively (in
thousands):
United States
$17,205
$15,986
$ 18,417
International
561
1,227
2,452
Total
$17,766
$ 17,213
$20,869
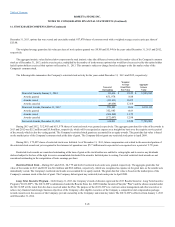
As of December 31, 2013 and 2012, the Company had outstanding receivables from stockholders of $0, and outstanding receivables from employees in
the amount of $55,000 and $60,000, respectively.
The following table includes the Company's valuation and qualifying accounts for the respective periods (in thousands):
Allowance for doubtful accounts:
Beginning balance
$1,297
$1,951
$1,761
Charged to costs and expenses
1,420
1,820
1,228
Deductions—accounts written off
(1,717)
(2,474)
(1,038)
Ending balance
$1,000
$1,297
$1,951
Sales return reserve:
Beginning balance
$5,883
$9,931
$8,391
Charged against revenue
14,258
11,148
24,922
Deductions—reserves utilized
(15,307)
(15,196)
(23,382)
Ending balance
$4,834
$5,883
9,931
Deferred income tax asset valuation allowance:
Beginning balance
$29,671
—
—
Charged to costs and expenses
9,566
29,671
—
Deductions
(5,371)
—
—
Ending balance
$33,866
$29,671
$ —