Rosetta Stone 2013 Annual Report Download - page 49
Download and view the complete annual report
Please find page 49 of the 2013 Rosetta Stone annual report below. You can navigate through the pages in the report by either clicking on the pages listed below, or by using the keyword search tool below to find specific information within the annual report.-
 1
1 -
2
-
3
-
4
-
5
-
6
-
7
-
8
-
9
-
10
-
11
-
12
-
13
-
14
-
15
-
16
-
17
-
18
-
19
-
20
-
21
-
22
-
23
-
24
-
25
-
26
-
27
-
28
-
29
-
30
-
31
-
32
-
33
-
34
-
35
-
36
-
37
-
38
-
 39
39 -
 40
40 -
 41
41 -
 42
42 -
 43
43 -
 44
44 -
 45
45 -
 46
46 -
 47
47 -
 48
48 -
 49
49 -
 50
50 -
 51
51 -
 52
52 -
 53
53 -
 54
54 -
 55
55 -
 56
56 -
 57
57 -
 58
58 -
 59
59 -
60
-
61
-
62
-
63
-
64
-
65
-
66
-
67
-
68
-
69
-
70
-
71
-
72
-
73
-
74
-
75
-
76
-
77
-
78
-
79
-
80
-
81
-
82
-
83
-
84
-
85
-
86
-
87
-
88
-
89
-
90
-
91
-
92
-
93
-
94
-
95
-
96
-
97
-
98
-
99
-
100
-
101
-
102
-
103
-
104
-
105
-
106
-
107
-
108
-
109
-
110
-
111
-
112
-
113
-
114
-
115
 |
 |

Table of Contents
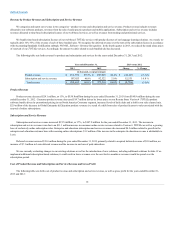
Sales and Marketing Expenses
Sales and marketing expenses for the year ended December 31, 2013 were $146.1 million, a decrease of $4.8 million, or 3%, from the year ended
December 31, 2012. As a percentage of total revenue, sales and marketing expenses were 55% for the years ended December 31, 2013, and 2012. The dollar
decrease in sales and marketing expenses were primarily attributable to a $2.8 million decrease in rent as the number of kiosk leases decreased from 87 at
December 31, 2012 to three as of December 31, 2013. We exited our U.S. kiosks in the second quarter of 2013. In addition, media and marketing expenses
decreased $1.7 million as we focused our efforts on advertising through online channels such as Facebook, Google AdWords, and email, and less on more
expensive television and radio commercials, which generally drive potential customers to our call centers. If we continue to move our media spend online this
could result in less traffic to our call centers that may not be offset by increases in web sales. Professional services expenses decreased $2.7 million. These
decreases were partially offset by a $2.1 million increase in payroll and benefits from the addition of Lexia and Livemocha personnel, severance expenses and
the 2013 long-term incentive plan and a $1.1 million increase in amortization due to the intangible assets acquired in the Livemocha and Lexia acquisitions.
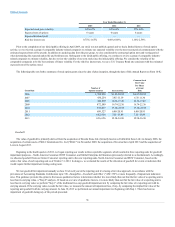
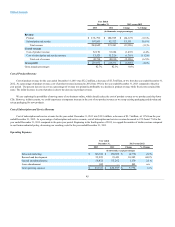
Research and Development Expenses
Research and development expenses were $34.0 million for the year ended December 31, 2013, an increase of $10.5 million, or 45%, from the year
ended December 31, 2012. As a percentage of revenue, research and development expenses increased to 13% from 9% for the year ended December 31, 2013
compared to the year ended December 31, 2012. The dollar and percentage increases were the result of our investment in strengthening our platforms and
bringing new innovative products to market including the opening of our new offices in San Francisco, CA and Austin, TX in the first quarter of 2013 and
our newly acquired office in Seattle, WA with the acquisition of Livemocha in April 2013. Compensation and relocation expenses increased $5.1 million as a
result of hiring more senior level managers as well as hiring in the more expensive markets of San Francisco, CA, and Seattle, WA. As a result of opening new
offices in 2013, rent expenses increased $0.6 million. In addition, with the acquisitions of Livemocha and Lexia, amortization of intangible assets increased
$0.5 million. Consulting expenses increased $3.6 million as we continue to develop new products.
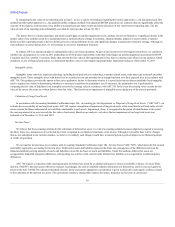
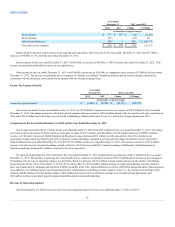
General and Administrative Expenses
General and administrative expenses for the year ended December 31, 2013 were $56.4 million, an increase of $1.2 million, or 2%, from the year ended
December 31, 2012. As a percentage of revenue, general and administrative expenses increased to 21% for the year ended December 31, 2013 compared to 20%
for year ended December 31, 2012. The dollar and percentage increases were primarily attributable to a $1.0 million increase in personnel related expenses due
to the start of the 2013 Rosetta Stone Inc. Long Term Incentive Plan ("2013 LTIP"), $0.5 million increase in professional services and a $0.4 million increase
in rent expense. These increases were partially offset by a $0.4 million increase in bad debt recoveries and $0.4 million decrease in depreciation expense related
to certain assets being fully depreciated early in the second quarter of 2012.
Lease Abandonment
In March 2013, we exited a portion of our facility in Japan as a result of excess office space. Accrued exit costs of $0.8 million associated with the partial
abandonment were charged to lease abandonment expenses in the first quarter of 2013.
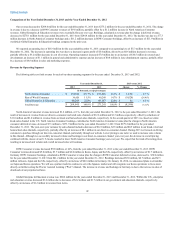
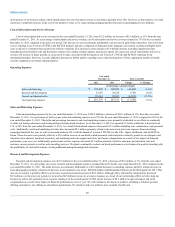
Stock-Based Compensation
Total stock-based compensation by expense line item is as follows:
Cost of revenue
$175
$ 288
$(113)
(39.2)%
Sales and marketing
1,840
1,185
655
55.3 %
Research and development
1,460
1,547
(87)
(5.6)%
General and administrative
5,766
4,989
777
15.6 %
Total
$9,241
$ 8,009
$ 1,232
15.4 %
Interest and Other Income (Expense)
46