Rosetta Stone 2013 Annual Report Download - page 67
Download and view the complete annual report
Please find page 67 of the 2013 Rosetta Stone annual report below. You can navigate through the pages in the report by either clicking on the pages listed below, or by using the keyword search tool below to find specific information within the annual report.-
 1
1 -
2
-
3
-
4
-
5
-
6
-
7
-
8
-
9
-
10
-
11
-
12
-
13
-
14
-
15
-
16
-
17
-
18
-
19
-
20
-
21
-
22
-
23
-
24
-
25
-
26
-
27
-
28
-
29
-
30
-
31
-
32
-
33
-
34
-
35
-
36
-
37
-
38
-
39
-
40
-
41
-
42
-
43
-
44
-
45
-
46
-
47
-
48
-
49
-
50
-
51
-
52
-
53
-
54
-
55
-
56
-
 57
57 -
 58
58 -
 59
59 -
 60
60 -
 61
61 -
 62
62 -
 63
63 -
 64
64 -
 65
65 -
 66
66 -
 67
67 -
 68
68 -
 69
69 -
 70
70 -
 71
71 -
 72
72 -
 73
73 -
 74
74 -
 75
75 -
 76
76 -
 77
77 -
78
-
79
-
80
-
81
-
82
-
83
-
84
-
85
-
86
-
87
-
88
-
89
-
90
-
91
-
92
-
93
-
94
-
95
-
96
-
97
-
98
-
99
-
100
-
101
-
102
-
103
-
104
-
105
-
106
-
107
-
108
-
109
-
110
-
111
-
112
-
113
-
114
-
115
 |
 |

Table of Contents
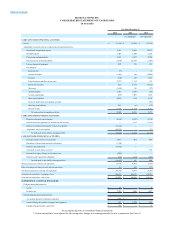
(As Adjusted)*
(As Adjusted)*
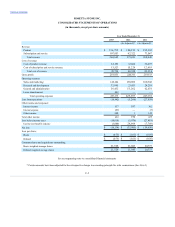
Revenue:
Product
$156,792
$180,919
$195,382
Subscription and service
107,853
92,322
73,067
Total revenue
264,645
273,241
268,449
Cost of revenue:
Cost of product revenue
32,191
33,684
36,497
Cost of subscription and service revenue
13,523
15,226
12,619
Total cost of revenue
45,714
48,910
49,116
Gross profit
218,931
224,331
219,333
Operating expenses
Sales and marketing
146,104
150,882
160,942
Research and development
33,995
23,453
24,218
General and administrative
56,432
55,262
62,031
Lease abandonment
842
—
—
Total operating expenses
237,373
229,597
247,191
Loss from operations
(18,442)
(5,266)
(27,858)
Other income and (expense):
Interest income
117
187
302
Interest expense
(61)
—
(5)
Other income
368
3
142
Total other income
424
190
439
Loss before income taxes
(18,018)
(5,076)
(27,419)
Income tax (benefit) expense
(1,884)
28,909
(7,769)
Net loss
$(16,134)
$ (33,985)
$(19,650)
Loss per share:
Basic
$(0.75)
$ (1.61)
$ (0.95)
Diluted
$(0.75)
$ (1.61)
$ (0.95)
Common shares and equivalents outstanding:
Basic weighted average shares
21,528
21,045
20,773
Diluted weighted average shares
21,528
21,045
20,773
See accompanying notes to consolidated financial statements
* Certain amounts have been adjusted for the retrospective change in accounting principle for sales commissions (See Note 3)
F-5