Rosetta Stone 2013 Annual Report Download - page 33
Download and view the complete annual report
Please find page 33 of the 2013 Rosetta Stone annual report below. You can navigate through the pages in the report by either clicking on the pages listed below, or by using the keyword search tool below to find specific information within the annual report.-
 1
1 -
2
-
3
-
4
-
5
-
6
-
7
-
8
-
9
-
10
-
11
-
12
-
13
-
14
-
15
-
16
-
17
-
18
-
19
-
20
-
21
-
22
-
 23
23 -
 24
24 -
 25
25 -
 26
26 -
 27
27 -
 28
28 -
 29
29 -
 30
30 -
 31
31 -
 32
32 -
 33
33 -
 34
34 -
 35
35 -
 36
36 -
 37
37 -
 38
38 -
 39
39 -
 40
40 -
 41
41 -
 42
42 -
 43
43 -
44
-
45
-
46
-
47
-
48
-
49
-
50
-
51
-
52
-
53
-
54
-
55
-
56
-
57
-
58
-
59
-
60
-
61
-
62
-
63
-
64
-
65
-
66
-
67
-
68
-
69
-
70
-
71
-
72
-
73
-
74
-
75
-
76
-
77
-
78
-
79
-
80
-
81
-
82
-
83
-
84
-
85
-
86
-
87
-
88
-
89
-
90
-
91
-
92
-
93
-
94
-
95
-
96
-
97
-
98
-
99
-
100
-
101
-
102
-
103
-
104
-
105
-
106
-
107
-
108
-
109
-
110
-
111
-
112
-
113
-
114
-
115
 |
 |
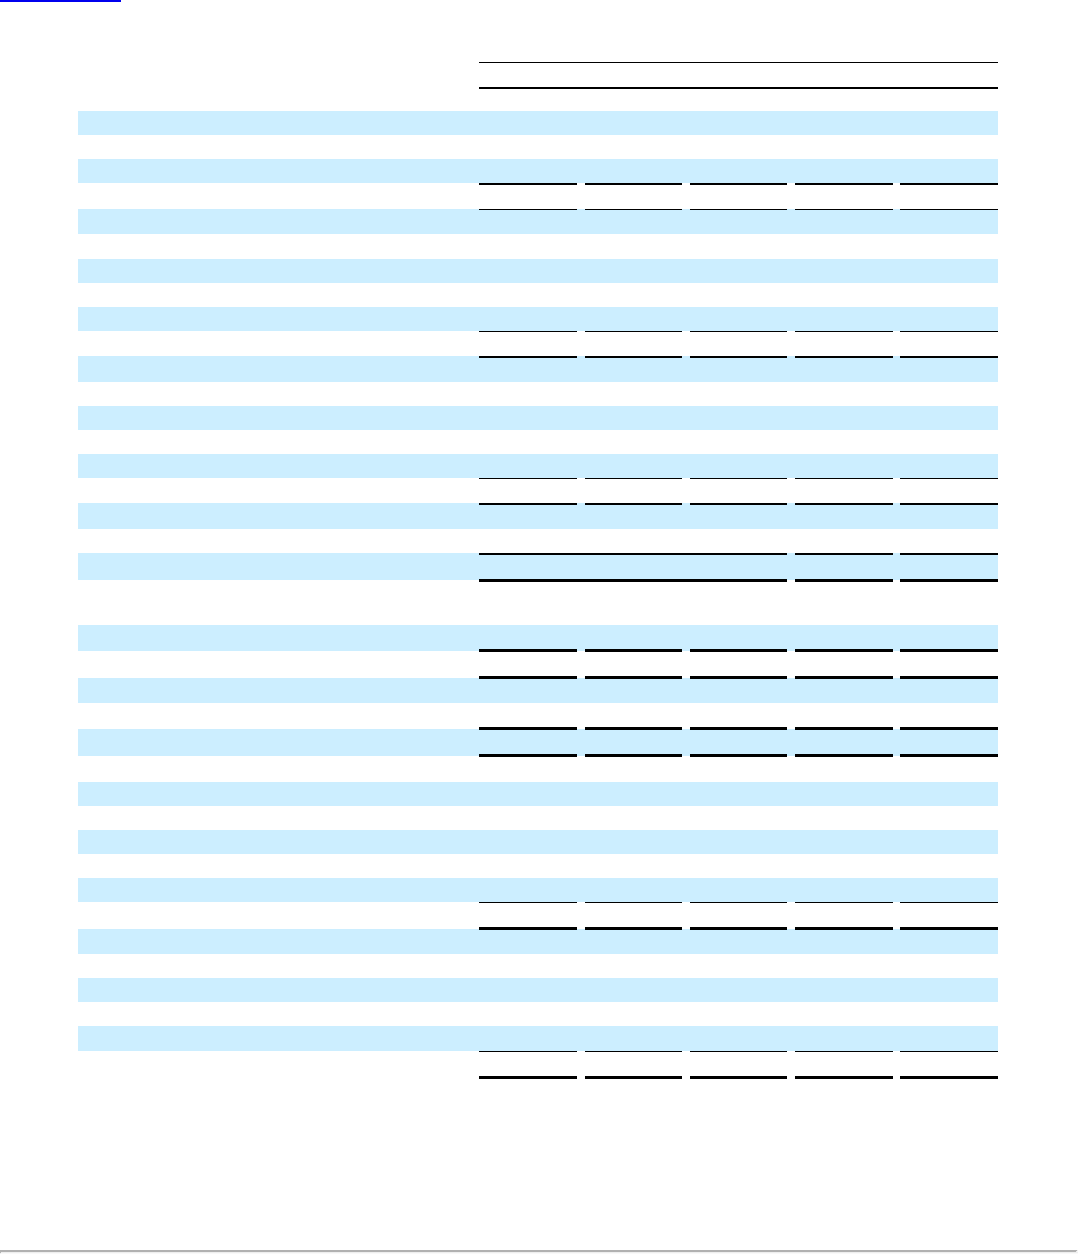
Table of Contents
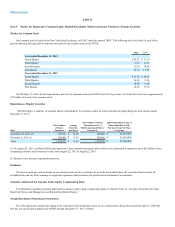
Revenue
$264,645
$273,241
$268,449
258,868
$252,271
Cost of revenue
45,714
48,910
49,116
38,999
33,427
Gross profit
218,931
224,331
219,333
219,869
218,844
Operating expenses:
Sales and marketing
146,104
150,882
160,942
130,335
115,108
Research and development
33,995
23,453
24,218
23,437
26,239
General and administrative
56,432
55,262
62,031
53,239
57,182
Lease abandonment
842
—
—
(583)
(8)
Total operating expenses
237,373
229,597
247,191
206,428
198,521
Income (loss) from operations
(18,442)
(5,266)
(27,858)
13,441
20,323
Other income and expense:
Interest income
117
187
302
262
159
Interest expense
(61)
—
(5)
(66)
(356)
Other (expense) income
368
3
142
(220)
112
Interest and other income (expense), net
424
190
439
(24)
(85)
Income (loss) before income taxes
(18,018)
(5,076)
(27,419)
13,417
20,238
Income tax expense (benefit)
(1,884)
28,909
(7,769)
(178)
7,010
Income (loss) attributable to common stockholders
(16,134)
(33,985)
(19,650)
13,595
$ 13,228
Income (loss) per share attributable to common
stockholders:
Basic
$(0.75)
$ (1.61)
$ (0.95)
0.67
$0.88
Diluted
$(0.75)
$ (1.61)
$ (0.95)
0.64
$0.66
Common shares and equivalents outstanding:
Basic weighted average shares
21,528
21,045
20,773
20,439
14,990
Diluted weighted average shares
21,528
21,045
20,773
21,187
19,930
Cost of revenue
$175
$ 288
$55
$ 39
$34
Sales and marketing
1,840
1,185
1,932
774
999
Research and development
1,460
1,547
2,448
1,181
5,959
General and administrative
5,766
4,989
7,918
2,393
15,158
Total stock-based compensation expense
$9,241
$ 8,009
$ 12,353
$4,387
$22,150
Cost of revenue
$244
$ —
$ —
$ —
$ —
Sales and marketing
1,028
—
45
58
42
Research and development
550
40
40
—
—
General and administrative
—
—
—
—
—
Total intangible amortization expense
$1,822
$40
$85
$58
$42
_______________________________________________________________________________
(1) As discussed in Note 5, the Company acquired Livemocha, Inc. on April 1, 2013 and acquired Lexia Learning Systems, Inc. on August 1, 2013.
The results of operations from these entities have been included from the acquisition date.
(2) As discussed in Note 15, the Company established a full valuation allowance to reduce the deferred tax assets of the Korea, Brazil, and Japan
subsidiaries and the U.S.
30