Rosetta Stone 2013 Annual Report Download - page 51
Download and view the complete annual report
Please find page 51 of the 2013 Rosetta Stone annual report below. You can navigate through the pages in the report by either clicking on the pages listed below, or by using the keyword search tool below to find specific information within the annual report.-
 1
1 -
2
-
3
-
4
-
5
-
6
-
7
-
8
-
9
-
10
-
11
-
12
-
13
-
14
-
15
-
16
-
17
-
18
-
19
-
20
-
21
-
22
-
23
-
24
-
25
-
26
-
27
-
28
-
29
-
30
-
31
-
32
-
33
-
34
-
35
-
36
-
37
-
38
-
39
-
40
-
 41
41 -
 42
42 -
 43
43 -
 44
44 -
 45
45 -
 46
46 -
 47
47 -
 48
48 -
 49
49 -
 50
50 -
 51
51 -
 52
52 -
 53
53 -
 54
54 -
 55
55 -
 56
56 -
 57
57 -
 58
58 -
 59
59 -
 60
60 -
 61
61 -
62
-
63
-
64
-
65
-
66
-
67
-
68
-
69
-
70
-
71
-
72
-
73
-
74
-
75
-
76
-
77
-
78
-
79
-
80
-
81
-
82
-
83
-
84
-
85
-
86
-
87
-
88
-
89
-
90
-
91
-
92
-
93
-
94
-
95
-
96
-
97
-
98
-
99
-
100
-
101
-
102
-
103
-
104
-
105
-
106
-
107
-
108
-
109
-
110
-
111
-
112
-
113
-
114
-
115
 |
 |

Table of Contents
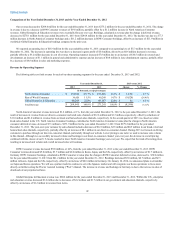
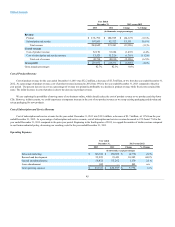
North America Consumer
$172,826
63.3%
$157,561
58.7%
$15,264
9.7 %
Rest of World Consumer
40,248
14.7%
50,465
18.8%
(10,217)
(20.2)%
Global Enterprise & Education
60,167
22.0%
60,423
22.5%
(255)
(0.4)%
Total Revenue
$273,241
100.0%
$268,449
100.0%
$4,792
1.8 %
North America Consumer revenue increased $15.3 million, or 10%, from the year ended December 31, 2011 to the year ended December 31, 2012, the
result of increases in revenue from our retail and direct-to-consumer sales channels of $12.5 million and $11.4 million, respectively, offset by a reduction of
$8.7 million in revenue from our kiosk sales channel. During 2012 we used aggressive promotions in our retail and direct-to-consumer channels, including
several promotions within the daily deals market. The number of kiosks within North America decreased from 103 at December 31, 2011 to 57 at
December 31, 2012, driving the decrease in revenue from this channel. North America Consumer bookings, calculated as North America Consumer revenue
plus the change in North America consumer deferred revenue, increased to $179.2 million for the year ended December 31, 2012 from $157.4 million for the
year ended December 31, 2011. The increase in North America Consumer bookings was driven by higher sales volume on lower prices.
ROW Consumer revenue decreased $10.2 million, or 20%, from the year ended December 31, 2011 to the year ended December 31, 2012. ROW
Consumer revenue decreased $4.2 million, $3.7 million and $1.6 million in Japan, Germany and the UK, respectively. ROW Consumer bookings,
calculated as ROW Consumer revenue plus the change in ROW Consumer deferred revenue, decreased to $41.2 million for the year ended December 31, 2012
from $54.0 million for the year ended December 31, 2011. Bookings decreased $5.6 million, $3.1 million, $2.4 million and $1.7 million in Japan,
Germany, Korea and the UK, respectively. During 2012 we experienced a decrease in revenue and bookings across all consumer channels in Japan. In
response to the softness in the Japan consumer sales we relocated the head of our consumer businesses to this country, strengthened our local management and
sales team and entered into new retail distribution agreements. In Germany the decrease in revenue and bookings is the result of no longer selling box product,
closing all kiosk locations, and shifting to an online, subscription-only product. The decline in revenue and bookings in the UK is also due to a decrease in
units sold and price points.
Global Enterprise & Education revenue decreased $0.3 million from the year ended December 31, 2011 to the year ended December 31, 2012. Despite the
non-renewal of the U.S. Army and U.S. Marine Corps contracts in 2011 which resulted in a $4.4 million decrease in revenue for the year ended December 31,
2012, Global Enterprise & Education revenue remained stable year-over-year, primarily driven by a $5.0 million increase in corporate revenues. International
enterprise and education revenues increased $2.7 million, or 49%, during the year ended December 31, 2012 compared to the prior year period, driven by
increases in the UK, Korea, and South America. Global Enterprise & Education bookings, calculated as enterprise and education revenue plus the change in
enterprise and education deferred revenue, increased to $64.4 million for the year ended December 31, 2012 from $61.8 million for the year ended
December 31, 2011. The increase was driven by growth in corporate and non-profit sales, partially offset by declines in our government and education
channels. We have recently added senior sales executives and sales representatives to this group to allow greater focus on growing this segment of the business.
Revenue by Product Revenue and Subscription and Service Revenue
We categorize and report our revenue in two categories—product revenue and subscription and service revenue. Product revenue includes revenues
allocated to the software product from sales of Rosetta Stone Version 4 and revenues from the sale of audio practice products. Subscription and
service revenue includes revenues allocated to time-based subscription licenses of our web-based services, as well as revenues from training and
professional services.
We began bundling time-based subscription licenses of our web-based services with product licenses of our Rosetta Stone Version 3 language-
learning solutions in the U.S. consumer market during the third quarter of 2010, in Japan during the first quarter of 2011, in the United Kingdom during the
second quarter of 2011, and in Korea during the third quarter of 2011, with the launch of Rosetta Stone Version 4 . As a result, we typically defer
10%-35% of the revenue of each of these bundled sales. We will recognize the deferred revenue over the term of the subscription license in accordance with
Accounting Standards Codification subtopic 985-605,
The following table sets forth revenue for products and subscription and services for the year ended December 31, 2012 and 2011:
48