Rosetta Stone 2013 Annual Report Download - page 41
Download and view the complete annual report
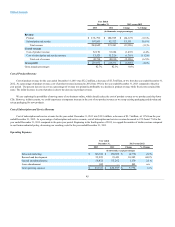
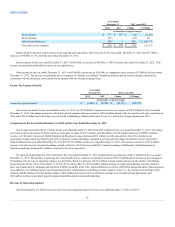
Please find page 41 of the 2013 Rosetta Stone annual report below. You can navigate through the pages in the report by either clicking on the pages listed below, or by using the keyword search tool below to find specific information within the annual report.-
 1
1 -
2
-
3
-
4
-
5
-
6
-
7
-
8
-
9
-
10
-
11
-
12
-
13
-
14
-
15
-
16
-
17
-
18
-
19
-
20
-
21
-
22
-
23
-
24
-
25
-
26
-
27
-
28
-
29
-
30
-
 31
31 -
 32
32 -
 33
33 -
 34
34 -
 35
35 -
 36
36 -
 37
37 -
 38
38 -
 39
39 -
 40
40 -
 41
41 -
 42
42 -
 43
43 -
 44
44 -
 45
45 -
 46
46 -
 47
47 -
 48
48 -
 49
49 -
 50
50 -
 51
51 -
52
-
53
-
54
-
55
-
56
-
57
-
58
-
59
-
60
-
61
-
62
-
63
-
64
-
65
-
66
-
67
-
68
-
69
-
70
-
71
-
72
-
73
-
74
-
75
-
76
-
77
-
78
-
79
-
80
-
81
-
82
-
83
-
84
-
85
-
86
-
87
-
88
-
89
-
90
-
91
-
92
-
93
-
94
-
95
-
96
-
97
-
98
-
99
-
100
-
101
-
102
-
103
-
104
-
105
-
106
-
107
-
108
-
109
-
110
-
111
-
112
-
113
-
114
-
115
 |
 |

Table of Contents
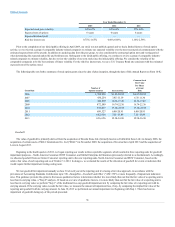
Expected stock price volatility
64%-67%
64%-66%
57%-64%
Expected term of options
6 years
6 years
6 years
Expected dividend yield
—
—
—
Risk-free interest rate
0.75%-1.65%
0.60%-0.88%
1.14%-2.59%
Prior to the completion of our initial public offering in April 2009, our stock was not publicly quoted and we had a limited history of stock option
activity, so we reviewed a group of comparable industry-related companies to estimate our expected volatility over the most recent period commensurate with the
estimated expected term of the awards. In addition to analyzing data from the peer group, we also considered the contractual option term and vesting period
when determining the expected option life and forfeiture rate. Subsequent to the initial public offering, we continue to review a group of comparable industry-
related companies to estimate volatility, but also review the volatility of our own stock since the initial public offering. We consider the volatility of the
comparable companies to be the best estimate of future volatility. For the risk-free interest rate, we use a U.S. Treasury Bond rate consistent with the estimated
expected term of the option award.
The following table sets forth a summary of stock option grants since the date of plan inception, through the date of this Annual Report on Form 10-K:
2006
1,704,950
$3.85-$3.85
$4.57-$5.92
2007
436,254
3.85-11.19
6.35-11.30
2008
402,805
10.36-17.49
10.36-17.49
2009
472,589
16.74-22.30
16.74-22.30
2010
593,017
17.10-25.99
17.10-25.99
2011
698,327
6.88-20.91
6.88-20.91
2012
662,856
7.51-13.89
7.51-13.89
2013
636,656
12.34-16.96
12.34-16.96
The value of goodwill is primarily derived from the acquisition of Rosetta Stone Ltd. (formerly known as Fairfield & Sons, Ltd.) in January 2006, the
acquisition of certain assets of SGLC International Co. Ltd ("SGLC") in November 2009, the acquisition of Livemocha in April 2013 and the acquisition of
Lexia in August 2013.
Beginning in the fourth quarter of 2012, we began reporting our results in three reportable segments, which resulted in three reporting units for goodwill
impairment purposes—North America Consumer, ROW Consumer, and Global Enterprise & Education (previously referred to as Institutional). Accordingly,
we allocated goodwill from our former Consumer reporting unit to the new reporting units, North America Consumer and ROW Consumer, based on the
relative fair value of each reporting unit as of October 31, 2012. In doing so, we evaluated the results of the allocation of goodwill for events or indicators that
would require further impairment testing, noting none.
We test goodwill for impairment annually on June 30 of each year at the reporting unit level using a fair value approach, in accordance with the
provisions of Accounting Standards Codification topic 350, ("ASC 350") or more frequently, if impairment indicators
arise. This guidance provides the option to first assess qualitative factors to determine whether it is more likely than not that the fair value of a reporting unit is
less than its carrying value, a "Step 0" analysis. If, based on a review of qualitative factors, it is more likely than not that the fair value of a reporting unit is
less than its carrying value we perform "Step 1" of the traditional two-step goodwill impairment test by comparing the fair value of a reporting unit with its
carrying amount. If the carrying value exceeds the fair value, we measure the amount of impairment loss, if any, by comparing the implied fair value of the
reporting unit goodwill with its carrying amount. At June 30, 2013 we performed our annual impairment test beginning with Step 1. There has been no
impairment of goodwill during any of the periods presented.
38