Rosetta Stone 2013 Annual Report Download - page 50
Download and view the complete annual report
Please find page 50 of the 2013 Rosetta Stone annual report below. You can navigate through the pages in the report by either clicking on the pages listed below, or by using the keyword search tool below to find specific information within the annual report.-
 1
1 -
2
-
3
-
4
-
5
-
6
-
7
-
8
-
9
-
10
-
11
-
12
-
13
-
14
-
15
-
16
-
17
-
18
-
19
-
20
-
21
-
22
-
23
-
24
-
25
-
26
-
27
-
28
-
29
-
30
-
31
-
32
-
33
-
34
-
35
-
36
-
37
-
38
-
39
-
 40
40 -
 41
41 -
 42
42 -
 43
43 -
 44
44 -
 45
45 -
 46
46 -
 47
47 -
 48
48 -
 49
49 -
 50
50 -
 51
51 -
 52
52 -
 53
53 -
 54
54 -
 55
55 -
 56
56 -
 57
57 -
 58
58 -
 59
59 -
 60
60 -
61
-
62
-
63
-
64
-
65
-
66
-
67
-
68
-
69
-
70
-
71
-
72
-
73
-
74
-
75
-
76
-
77
-
78
-
79
-
80
-
81
-
82
-
83
-
84
-
85
-
86
-
87
-
88
-
89
-
90
-
91
-
92
-
93
-
94
-
95
-
96
-
97
-
98
-
99
-
100
-
101
-
102
-
103
-
104
-
105
-
106
-
107
-
108
-
109
-
110
-
111
-
112
-
113
-
114
-
115
 |
 |

Table of Contents
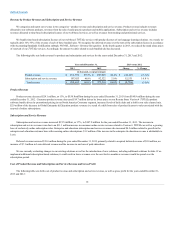
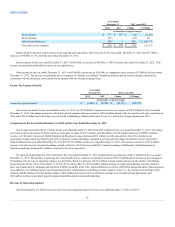
Interest Income
$117
$ 187
$(70)
(37.4)%
Interest Expense
(61)
—
(61)
n/a
Other Income (Expense)
368
3
365
12,166.7 %
Total other income (expense)
$424
$ 190
$234
123.2 %
Interest income represents interest earned on our cash and cash equivalents. Interest income for the year ended December 31, 2013 was $117,000, a
decrease of $70,000, or 37%, from the year ended December 31, 2012.
Interest expense for the year ended December 31, 2013 was $61,000, an increase of $61,000, or 100% from the year ended December 31, 2012. This
increase was primarily attributable to interest on our capital leases.
Other income for the year ended December 31, 2013 was $368,000, an increase of $365,000, as compared to other income of $3,000 for the year ended
December 31, 2012. The increase was primarily due to a donation of software to a children's foundation in Korea and an increase in legal settlements in
connection with our anti-piracy enforcement efforts, partially offset by foreign exchange losses.
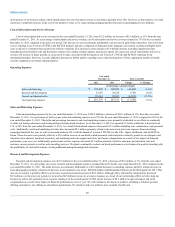
Income tax expense (benefit)
$(1,884)
$28,909
$(30,793)
(106.5)%
Our income tax benefit for the year ended December 31, 2013 was $1.9 million, compared to income tax expense of $28.9 million for the year ended
December 31, 2012. The change primarily resulted from partial valuation allowance releases of $5.4 million related to the Livemocha and Lexia acquisitions in
2013 and a $26.0 million non-cash charge associated with establishing a valuation allowance for our U.S. and certain foreign operations in 2012.
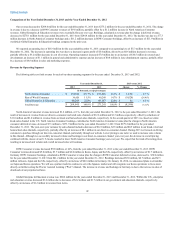
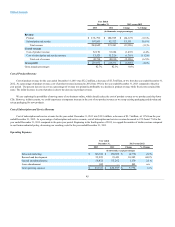
Our revenue increased to $273.2 million for the year ended December 31, 2012 from $268.4 million for the year ended December 31, 2011. The change
in revenue is due to an increase in North American Consumer revenues of $15.3 million, partially offset by a $10.2 million decrease in ROW Consumer
revenue, over the prior year period. Global Enterprise & Education revenues decreased $0.3 million over the same period, driven by a decline in our
government channel which was offset by growth in corporate revenues. Bookings, calculated as revenue plus the change in deferred revenue, increased to
$284.8 million for the year ended December 31, 2012 from $273.2 million for the year ended December 31, 2011. The increase was due to a $21.8 million
increase in North America Consumer bookings, partially offset by a $12.8 decrease in ROW Consumer bookings. Additionally, Global Enterprise &
Education bookings increased $2.6 million compared to the prior year period.
We reported an operating loss of $5.3 million for the year ended December 31, 2012 compared to an operating loss of $27.9 million for the year ended
December 31, 2011. The decrease in operating loss was primarily due to a decrease in operating expenses of $17.6 million and an increase in gross margin of
$5.0 million. The decrease in operating expenses was primarily related to a decrease of $12.3 million in kiosk related expenses as the number of worldwide
kiosks decreased from 174 as of December 31, 2011 to 87 as of December 31, 2012 and $8.2 million decrease in media and marketing activities related to
prior year brand identity campaigns and Version 4 launches in the U.K., Japan and Korea, as well as in Korea and Japan. These decreases
were offset by a $1.9 million increase in restructuring and other related expenses including severance expense in the U.S., the closing of our Germany office
location, and the closing of several kiosks in Japan, a $0.6 million increase in VAT tax related to a change in our transfer pricing agreements, and
$0.6 million increase in non-kiosk payroll expenses primarily related to sales and marketing.
The following table sets forth revenue for each of our three operating segments for the years ended December 31, 2012 and 2011:
47