Rosetta Stone 2013 Annual Report Download - page 36
Download and view the complete annual report
Please find page 36 of the 2013 Rosetta Stone annual report below. You can navigate through the pages in the report by either clicking on the pages listed below, or by using the keyword search tool below to find specific information within the annual report.-
 1
1 -
2
-
3
-
4
-
5
-
6
-
7
-
8
-
9
-
10
-
11
-
12
-
13
-
14
-
15
-
16
-
17
-
18
-
19
-
20
-
21
-
22
-
23
-
24
-
25
-
 26
26 -
 27
27 -
 28
28 -
 29
29 -
 30
30 -
 31
31 -
 32
32 -
 33
33 -
 34
34 -
 35
35 -
 36
36 -
 37
37 -
 38
38 -
 39
39 -
 40
40 -
 41
41 -
 42
42 -
 43
43 -
 44
44 -
 45
45 -
 46
46 -
47
-
48
-
49
-
50
-
51
-
52
-
53
-
54
-
55
-
56
-
57
-
58
-
59
-
60
-
61
-
62
-
63
-
64
-
65
-
66
-
67
-
68
-
69
-
70
-
71
-
72
-
73
-
74
-
75
-
76
-
77
-
78
-
79
-
80
-
81
-
82
-
83
-
84
-
85
-
86
-
87
-
88
-
89
-
90
-
91
-
92
-
93
-
94
-
95
-
96
-
97
-
98
-
99
-
100
-
101
-
102
-
103
-
104
-
105
-
106
-
107
-
108
-
109
-
110
-
111
-
112
-
113
-
114
-
115
 |
 |

Table of Contents
Product software revenue includes sales of our Rosetta Stone Version 4 product. We anticipate the mix of product units will shift from our
traditional CD-ROM product to digital downloads in future periods. There is no difference in price between the two options.
Worldwide consumer revenue from product software decreased $18.9 million from the year ended December 31, 2012 to the year ended December 31,
2013, driven by a 17% decrease in the average revenue per unit, partially offset by a 8% increase in the number of units sold, compared to the prior year
period. Worldwide consumer revenue from product software decreased $1.9 million from the year ended December 31, 2011 to the year ended December 31,
2012, driven by an 8% decrease in the average revenue per unit, partially offset by an 8% increase in the number of units sold, compared to the prior year
period. Average revenue per product software unit has decreased as we have experimented with different price points and promotional offerings since the
introduction of Version 4 in 2010 including distribution partnerships within the daily deals market. The increase in product software units is due to
our expansion into international markets and decreasing price points.
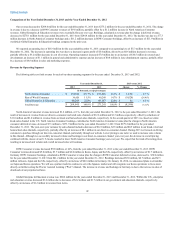
Worldwide ARPU decreased $52, or 17%, from $315 for the year ended December 31, 2012 to $263 for the year ended December 31, 2013. The
decline in ARPU is the result of multiple factors; 94% of the 17% reduction is associated with lower prices, which was driven by promotional pricing in
North American Consumer, increased levels of daily deals at lower prices and increased price discounting in ROW Consumer. 6% of the 17% decrease in
ARPU is due to our overall change in our sales channel mix. In the second quarter of 2013, we closed our entire U.S. kiosk sales channel. As a result,
customers who would have purchased our products via kiosks made those purchases mainly in our 3rd party retail sales channel, which are sold to the
retailers at lower prices. 79% of the decline in ARPU is attributable to declines in North America Consumer and 21% is due to declines in ROW Consumer.
We are testing ways to stabilize prices and reduce discounting, however, in the near term we expect ARPU to continue to decline.
Revenue from paid online learners increased $9.7 million from the year ended December 31, 2012 to the year ended December 31, 2013, driven by a
38% increase in the number of paid online learners as of December 31, 2013, compared to the prior period. This increase was partially offset by a decrease in
the average revenue per online learner due to the decrease in paid online subscription price points implemented in September 2013. Revenue from paid online
learners increased $6.9 million from the year ended December 31, 2011 to the year ended December 31, 2012, driven by a 157% increase in the number of
paid online learners as of December 31, 2012, compared to the prior period. This increase was partially offset by a decrease in the average revenue per online
learner due to continued testing of online products at different price points.
In addition to the unit and learner metrics described above, management also uses bookings to evaluate the overall health of the business and evaluate
performance. Bookings represent executed sales contracts received by the Company that are either recorded immediately as revenue or as deferred revenue.
Management believes that bookings provides useful information to investors regarding certain financial and business trends relating to the Company’s
financial condition and results of operations.
We derive revenue from sales of language learning and reading solutions consisting of product software, audio practice products, professional services,
and online software subscriptions. Revenue is presented as product revenue or subscription and service revenue in our consolidated financial statements. Our
audio practice products are normally combined with our product software products and sold as a solution.
Our professional services include training, implementation services and dedicated conversational coaching associated with Rosetta Stone .
Rosetta Stone online combines dedicated conversational coaching and an online software subscription. Rosetta Stone Version 4 combines
product software and dedicated conversational coaching. The content of our product software and subscription offerings are the same. We offer our customers
the ability to choose which format they prefer without differentiating the learning experience. We bundle time-based subscription licenses of our web-based
33