Quest Diagnostics 2005 Annual Report Download - page 85
Download and view the complete annual report
Please find page 85 of the 2005 Quest Diagnostics annual report below. You can navigate through the pages in the report by either clicking on the pages listed below, or by using the keyword search tool below to find specific information within the annual report.
QUEST DIAGNOSTICS INCORPORATED AND SUBSIDIARIES
NOTES TO CONSOLIDATED FINANCIAL STATEMENTS - CONTINUED
(dollars in thousands unless otherwise indicated)
Taxes on Income
The Company uses the asset and liability approach to account for income taxes. Under this method,
deferred tax assets and liabilities are recognized for the expected future tax consequences of differences between
the carrying amounts of assets and liabilities and their respective tax bases using tax rates in effect for the year
in which the differences are expected to reverse. A valuation allowance is provided when it is more likely than
not that some portion or all of the deferred tax assets will not be realized. The effect on deferred tax assets
and liabilities of a change in tax rates is recognized in income in the period when the change is enacted.
Earnings Per Share
Basic earnings per common share is calculated by dividing net income by the weighted average common
shares outstanding. Diluted earnings per common share is calculated by dividing net income, adjusted for the
after-tax impact of the interest expense associated with the Company’s 1
3
⁄
4
% contingent convertible debentures
due 2021 (the “Debentures’’), by the weighted average common shares outstanding after giving effect to all
potentially dilutive common shares outstanding during the period. Potentially dilutive common shares include the
dilutive effect of the Debentures, and outstanding stock options and restricted common shares granted under the
Company’s Amended and Restated Employee Long-Term Incentive Plan and Amended and Restated Director
Long-Term Incentive Plan.
On June 20, 2005, the Company effected a two-for-one stock split through the issuance of a stock dividend
of one new share of common stock for each share of common stock held by stockholders of record on June 6,
2005. References to the number of common shares and per common share amounts in the accompanying
consolidated balance sheets and consolidated statements of operations, including earnings per common share
calculations and related disclosures, have been restated to give retroactive effect to the stock split for all periods
presented.
In September 2004, the Emerging Issues Task Force (“EITF’’) reached a final consensus on Issue 04-8,
“The Effect of Contingently Convertible Instruments on Diluted Earnings per Share’’, (“Issue 04-8’’), effective
December 31, 2004. Pursuant to Issue 04-8, the Company included the dilutive effect of its Debentures in its
dilutive earnings per common share calculations using the if-converted method, regardless of whether or not the
holders of these securities were permitted to exercise their conversion rights. The Debentures were called for
redemption by the Company in December 2004, and redeemed as of January 18, 2005. See Note 10 for further
discussion of the Debentures.
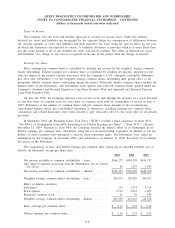
The computation of basic and diluted earnings per common share (using the if-converted method) was as
follows (in thousands, except per share data):
2005 2004 2003
Net income available to common stockholders – basic .............. $546,277 $499,195 $436,717
Add: Interest expense associated with the Debentures, net of related
tax effects ..................................................... 82 3,275 3,303
Net income available to common stockholders – diluted ............ $546,359 $502,470 $440,020
Weighted average common shares outstanding – basic .............. 201,833 203,920 206,832
Effect of dilutive securities:
Debentures ...................................................... 153 5,714 5,714
Stock options .................................................... 3,533 4,472 4,687
Restricted common stock ......................................... 11 39 345
Weighted average common shares outstanding – diluted ............ 205,530 214,145 217,578
Basic earnings per common share ................................. $ 2.71 $ 2.45 $ 2.11
Diluted earnings per common share ............................... $ 2.66 $ 2.35 $ 2.02
F-8


