Quest Diagnostics 2005 Annual Report Download - page 60
Download and view the complete annual report
Please find page 60 of the 2005 Quest Diagnostics annual report below. You can navigate through the pages in the report by either clicking on the pages listed below, or by using the keyword search tool below to find specific information within the annual report.-
 1
1 -
2
-
3
-
4
-
5
-
6
-
7
-
8
-
9
-
10
-
11
-
12
-
13
-
14
-
15
-
16
-
17
-
18
-
19
-
20
-
21
-
22
-
23
-
24
-
25
-
26
-
27
-
28
-
29
-
30
-
31
-
32
-
33
-
34
-
35
-
36
-
37
-
38
-
39
-
40
-
41
-
42
-
43
-
44
-
45
-
46
-
47
-
48
-
49
-
 50
50 -
 51
51 -
 52
52 -
 53
53 -
 54
54 -
 55
55 -
 56
56 -
 57
57 -
 58
58 -
 59
59 -
 60
60 -
 61
61 -
 62
62 -
 63
63 -
 64
64 -
 65
65 -
 66
66 -
 67
67 -
 68
68 -
 69
69 -
 70
70 -
71
-
72
-
73
-
74
-
75
-
76
-
77
-
78
-
79
-
80
-
81
-
82
-
83
-
84
-
85
-
86
-
87
-
88
-
89
-
90
-
91
-
92
-
93
-
94
-
95
-
96
-
97
-
98
-
99
-
100
-
101
-
102
-
103
-
104
-
105
-
106
-
107
-
108
-
109
-
110
-
111
-
112
-
113
-
114
-
115
-
116
-
117
-
118
 |
 |

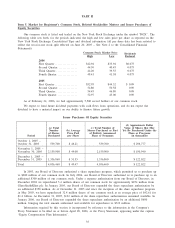
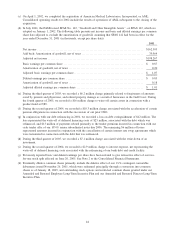
SELECTED HISTORICAL FINANCIAL DATA OF OUR COMPANY
The following table summarizes selected historical financial data of our Company and our subsidiaries at the
dates and for each of the periods presented. We derived the selected historical financial data for the years 2001
through 2005 from the audited consolidated financial statements of our Company. In April 2002, the Financial
Accounting Standards Board, or FASB, issued Statement of Financial Accounting Standards, or SFAS, No. 145,
“Rescission of FASB Statements No. 4, 44 and 64, Amendment of FASB Statement No. 13, and Technical
Corrections’’, or SFAS 145. Pursuant to SFAS 145, extraordinary losses associated with the extinguishment of debt in
2001, previously presented net of applicable taxes, were reclassified to other non-operating expenses. In September
2004, the Emerging Issues Task Force reached a final consensus on Issue 04-8, “The Effect of Contingently
Convertible Instruments on Diluted Earnings per Share’’, or Issue 04-8, effective December 31, 2004. Pursuant to
Issue 04-8, we included the dilutive effect of our 1
3
⁄
4
% contingent convertible debentures issued November 26, 2001
in our dilutive earnings per common share calculations using the if-converted method, regardless of whether or not
the holders of these securities were permitted to exercise their conversion rights, and retroactively restated previously
reported diluted earnings per common share. The selected historical financial data is only a summary and should be
read together with the audited consolidated financial statements and related notes of our Company and management’s
discussion and analysis of financial condition and results of operations included elsewhere in this Annual Report on
Form 10-K.
Year Ended December 31,
2005(a) 2004 2003(b) 2002(c) 2001
(in thousands, except per share data)
Operations Data:
Net revenues ..................... $5,503,711 $5,126,601 $4,737,958 $4,108,051 $3,627,771
Amortization of goodwill (d) ...... - - - - 38,392
Operating income................. 968,111 (e) 891,217 (f) 796,454 592,142 411,550
Loss on debt extinguishment ....... - - - - 42,012 (g)
Net income ...................... 546,277 (e),(h) 499,195 (f),(i) 436,717 322,154 162,303 (g)
Basic earnings per common share
(j) ............................ $ 2.71 $ 2.45 $ 2.11 $ 1.67 $ 0.87
Diluted earnings per common share
(j)(k) .......................... $ 2.66 $ 2.35 $ 2.02 $ 1.59 $ 0.83
Dividends per common share (j) . . . $ 0.36 $ 0.30 $ 0.075 $ - $ -
Balance Sheet Data (at end of year):
Cash and cash equivalents ......... $ 92,130 $ 73,302 $ 154,958 $ 96,777 $ 122,332
Accounts receivable, net ........... 732,907 649,281 609,187 522,131 508,340
Goodwill, net .................... 3,197,227 2,506,950 2,518,875 1,788,850 1,351,123
Total assets ...................... 5,306,115 4,203,788 4,301,418 3,324,197 2,930,555
Long-term debt ................... 1,255,386 724,021 1,028,707 796,507 820,337
Total debt ........................ 1,592,225 1,098,822 1,102,657 822,539 821,741
Total stockholders’ equity ......... 2,762,984 2,288,651 2,394,694 1,768,863 1,335,987
Other Data:
Net cash provided by operating
activities ...................... $ 851,583 $ 798,780 $ 662,799 $ 596,371 $ 465,803
Net cash used in investing activities (1,079,793) (173,700) (417,050) (477,212) (296,616)
Net cash provided by (used in)
financing activities ............. 247,038 (706,736) (187,568) (144,714) (218,332)
Provision for doubtful accounts .... 233,628 226,310 228,222 217,360 218,271
Rent expense ..................... 139,660 132,883 120,748 96,547 82,769
Capital expenditures .............. 224,270 176,125 174,641 155,196 148,986
Depreciation and amortization ..... 176,124 168,726 153,903 131,391 147,727
(a) On November 1, 2005, we completed the acquisition of LabOne, Inc., or LabOne. Consolidated operating results
for 2005 include the results of operations of LabOne subsequent to the closing of the acquisition. See Note 3 to
the Consolidated Financial Statements.
(b) On February 28, 2003, we completed the acquisition of Unilab Corporation, or Unilab. Consolidated operating
results for 2003 include the results of operations of Unilab subsequent to the closing of the acquisition. See
Note 3 to the Consolidated Financial Statements.
43