Quest Diagnostics 2005 Annual Report Download - page 112
Download and view the complete annual report
Please find page 112 of the 2005 Quest Diagnostics annual report below. You can navigate through the pages in the report by either clicking on the pages listed below, or by using the keyword search tool below to find specific information within the annual report.-
 1
1 -
2
-
3
-
4
-
5
-
6
-
7
-
8
-
9
-
10
-
11
-
12
-
13
-
14
-
15
-
16
-
17
-
18
-
19
-
20
-
21
-
22
-
23
-
24
-
25
-
26
-
27
-
28
-
29
-
30
-
31
-
32
-
33
-
34
-
35
-
36
-
37
-
38
-
39
-
40
-
41
-
42
-
43
-
44
-
45
-
46
-
47
-
48
-
49
-
50
-
51
-
52
-
53
-
54
-
55
-
56
-
57
-
58
-
59
-
60
-
61
-
62
-
63
-
64
-
65
-
66
-
67
-
68
-
69
-
70
-
71
-
72
-
73
-
74
-
75
-
76
-
77
-
78
-
79
-
80
-
81
-
82
-
83
-
84
-
85
-
86
-
87
-
88
-
89
-
90
-
91
-
92
-
93
-
94
-
95
-
96
-
97
-
98
-
99
-
100
-
101
-
 102
102 -
 103
103 -
 104
104 -
 105
105 -
 106
106 -
 107
107 -
 108
108 -
 109
109 -
 110
110 -
 111
111 -
 112
112 -
 113
113 -
 114
114 -
 115
115 -
 116
116 -
 117
117 -
 118
118
 |
 |

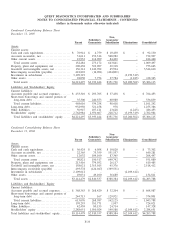
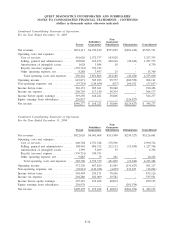
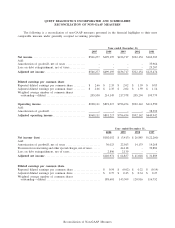
QUEST DIAGNOSTICS INCORPORATED AND SUBSIDIARIES
NOTES TO CONSOLIDATED FINANCIAL STATEMENTS - CONTINUED
(dollars in thousands unless otherwise indicated)
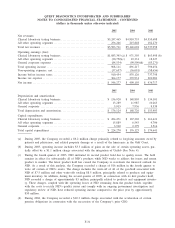
Condensed Consolidating Statement of Operations
For the Year Ended December 31, 2003
Non-
Subsidiary Guarantor
Parent Guarantors Subsidiaries Eliminations Consolidated
Net revenues ............................. $ 791,399 $3,709,590 $467,559 $(230,590) $4,737,958
Operating costs and expenses:
Cost of services ....................... 457,819 2,147,387 163,417 - 2,768,623
Selling, general and administrative ...... 76,626 880,951 223,762 (15,639) 1,165,700
Amortization of intangible assets ........ 1,723 6,461 17 - 8,201
Royalty (income) expense .............. (308,495) 308,495 - - -
Other operating expense (income), net . . . 119 (2,197) 1,058 - (1,020)
Total operating costs and expenses .... 227,792 3,341,097 388,254 (15,639) 3,941,504
Operating income ........................ 563,607 368,493 79,305 (214,951) 796,454
Non-operating expenses, net............... (65,689) (202,146) (5,772) 214,951 (58,656)
Income before taxes ...................... 497,918 166,347 73,533 - 737,798
Income tax expense ...................... 204,795 66,539 29,747 - 301,081
Income before equity earnings ............ 293,123 99,808 43,786 - 436,717
Equity earnings from subsidiaries ......... 143,594 - - (143,594) -
Net income .............................. $ 436,717 $ 99,808 $ 43,786 $(143,594) $ 436,717
Condensed Consolidating Statement of Cash Flows
For the Year Ended December 31, 2005
Non-
Subsidiary Guarantor
Parent Guarantors Subsidiaries Eliminations Consolidated
Cash flows from operating activities:
Net income ............................ $ 546,277 $ 168,221 $ 58,606 $(226,827) $ 546,277
Adjustments to reconcile net income to
net cash provided by operating
activities:
Depreciation and amortization ......... 51,943 113,506 10,675 - 176,124
Provision for doubtful accounts ....... 5,659 43,669 184,300 - 233,628
Other, net ............................ (203,458) 33,809 20,511 226,827 77,689
Changes in operating assets and
liabilities .......................... 174,884 (214,707) (142,312) - (182,135)
Net cash provided by operating activities . . . 575,305 144,498 131,780 - 851,583
Net cash used in investing activities ..... (1,020,236) (176,202) (15,243) 131,888 (1,079,793)
Net cash provided by (used in) financing
activities ............................. 465,448 30,405 (116,927) (131,888) 247,038
Net change in cash and cash equivalents .... 20,517 (1,299) (390) - 18,828
Cash and cash equivalents, beginning of
year ................................. 56,424 6,058 10,820 - 73,302
Cash and cash equivalents, end of year . . $ 76,941 $ 4,759 $ 10,430 $ - $ 92,130
F-35