Quest Diagnostics 2005 Annual Report Download - page 113
Download and view the complete annual report
Please find page 113 of the 2005 Quest Diagnostics annual report below. You can navigate through the pages in the report by either clicking on the pages listed below, or by using the keyword search tool below to find specific information within the annual report.-
 1
1 -
2
-
3
-
4
-
5
-
6
-
7
-
8
-
9
-
10
-
11
-
12
-
13
-
14
-
15
-
16
-
17
-
18
-
19
-
20
-
21
-
22
-
23
-
24
-
25
-
26
-
27
-
28
-
29
-
30
-
31
-
32
-
33
-
34
-
35
-
36
-
37
-
38
-
39
-
40
-
41
-
42
-
43
-
44
-
45
-
46
-
47
-
48
-
49
-
50
-
51
-
52
-
53
-
54
-
55
-
56
-
57
-
58
-
59
-
60
-
61
-
62
-
63
-
64
-
65
-
66
-
67
-
68
-
69
-
70
-
71
-
72
-
73
-
74
-
75
-
76
-
77
-
78
-
79
-
80
-
81
-
82
-
83
-
84
-
85
-
86
-
87
-
88
-
89
-
90
-
91
-
92
-
93
-
94
-
95
-
96
-
97
-
98
-
99
-
100
-
101
-
102
-
 103
103 -
 104
104 -
 105
105 -
 106
106 -
 107
107 -
 108
108 -
 109
109 -
 110
110 -
 111
111 -
 112
112 -
 113
113 -
 114
114 -
 115
115 -
 116
116 -
 117
117 -
 118
118
 |
 |

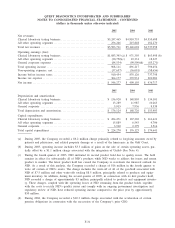
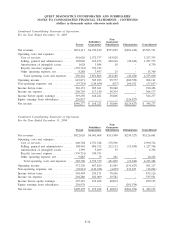
QUEST DIAGNOSTICS INCORPORATED AND SUBSIDIARIES
NOTES TO CONSOLIDATED FINANCIAL STATEMENTS - CONTINUED
(dollars in thousands unless otherwise indicated)
Condensed Consolidating Statement of Cash Flows
For the Year Ended December 31, 2004
Non-
Subsidiary Guarantor
Parent Guarantors Subsidiaries Eliminations Consolidated
Cash flows from operating activities:
Net income .............................. $ 499,195 $ 153,102 $ 48,874 $(201,976) $ 499,195
Adjustments to reconcile net income to net
cash provided by (used in) operating
activities:
Depreciation and amortization ........... 56,399 101,856 10,471 - 168,726
Provision for doubtful accounts ......... 4,940 43,638 177,732 - 226,310
Other, net ............................. (71,374) 1,754 16,847 201,976 149,203
Changes in operating assets and
liabilities ............................ 163,057 (118,129) (289,582) - (244,654)
Net cash provided by (used in) operating
activities............................... 652,217 182,221 (35,658) - 798,780
Net cash used in investing activities ....... (150,826) (105,597) (7,841) 90,564 (173,700)
Net cash provided by (used in) financing
activities............................... (586,555) (72,557) 42,940 (90,564) (706,736)
Net change in cash and cash equivalents. . . (85,164) 4,067 (559) - (81,656)
Cash and cash equivalents, beginning of
year ................................... 141,588 1,991 11,379 - 154,958
Cash and cash equivalents, end of year .... $ 56,424 $ 6,058 $ 10,820 $ - $ 73,302
Condensed Consolidating Statement of Cash Flows
For the Year Ended December 31, 2003
Non-
Subsidiary Guarantor
Parent Guarantors Subsidiaries Eliminations Consolidated
Cash flows from operating activities:
Net income .............................. $ 436,717 $ 99,808 $ 43,786 $(143,594) $ 436,717
Adjustments to reconcile net income to net
cash provided by operating activities:
Depreciation and amortization ........... 53,611 91,501 8,791 - 153,903
Provision for doubtful accounts ......... 4,944 64,835 158,443 - 228,222
Other, net ............................. (78,968) 2,463 18,604 143,594 85,693
Changes in operating assets and
liabilities ............................ 54,277 (178,027) (117,986) - (241,736)
Net cash provided by operating activities . . . 470,581 80,580 111,638 - 662,799
Net cash used in investing activities ....... (271,820) (96,957) (17,342) (30,931) (417,050)
Net cash provided by (used in) financing
activities............................... (136,188) 10,991 (93,302) 30,931 (187,568)
Net change in cash and cash equivalents. . . 62,573 (5,386) 994 - 58,181
Cash and cash equivalents, beginning of
year ................................... 79,015 7,377 10,385 - 96,777
Cash and cash equivalents, end of year .... $ 141,588 $ 1,991 $ 11,379 $ - $ 154,958
F-36