Quest Diagnostics 2005 Annual Report Download - page 116
Download and view the complete annual report
Please find page 116 of the 2005 Quest Diagnostics annual report below. You can navigate through the pages in the report by either clicking on the pages listed below, or by using the keyword search tool below to find specific information within the annual report.-
 1
1 -
2
-
3
-
4
-
5
-
6
-
7
-
8
-
9
-
10
-
11
-
12
-
13
-
14
-
15
-
16
-
17
-
18
-
19
-
20
-
21
-
22
-
23
-
24
-
25
-
26
-
27
-
28
-
29
-
30
-
31
-
32
-
33
-
34
-
35
-
36
-
37
-
38
-
39
-
40
-
41
-
42
-
43
-
44
-
45
-
46
-
47
-
48
-
49
-
50
-
51
-
52
-
53
-
54
-
55
-
56
-
57
-
58
-
59
-
60
-
61
-
62
-
63
-
64
-
65
-
66
-
67
-
68
-
69
-
70
-
71
-
72
-
73
-
74
-
75
-
76
-
77
-
78
-
79
-
80
-
81
-
82
-
83
-
84
-
85
-
86
-
87
-
88
-
89
-
90
-
91
-
92
-
93
-
94
-
95
-
96
-
97
-
98
-
99
-
100
-
101
-
102
-
103
-
104
-
105
-
 106
106 -
 107
107 -
 108
108 -
 109
109 -
 110
110 -
 111
111 -
 112
112 -
 113
113 -
 114
114 -
 115
115 -
 116
116 -
 117
117 -
 118
118
 |
 |

QUEST DIAGNOSTICS INCORPORATED AND SUBSIDIARIES
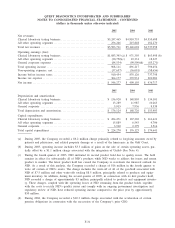
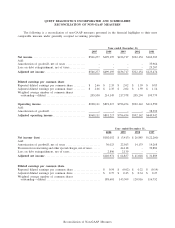
RECONCILIATION OF NON-GAAP MEASURES
The following is a reconciliation of non-GAAP measures presented in the financial highlights to their most
comparable measure under generally accepted accounting principles.
Year ended December 31,
2005 2004 2003 2002 2001
Net income ........................................ $546,277 $499,195 $436,717 $322,154 $162,303
Add:
Amortization of goodwill, net of taxes ............... ----35,964
Loss on debt extinguishment, net of taxes ............ ----25,207
Adjusted net income ............................... $546,277 $499,195 $436,717 $322,154 $223,474
Diluted earnings per common share
Reported diluted earnings per common share ......... $ 2.66 $ 2.35 $ 2.02 $ 1.59 $ 0.83
Adjusted diluted earnings per common share ......... $ 2.66 $ 2.35 $ 2.02 $ 1.59 $ 1.14
Weighted average number of common shares
outstanding—diluted .............................. 205,530 214,145 217,578 205,294 195,779
Operating income .................................. $968,111 $891,217 $796,454 $592,142 $411,550
Add:
Amortization of goodwill ............................ ----38,392
Adjusted operating income ......................... $968,111 $891,217 $796,454 $592,142 $449,942
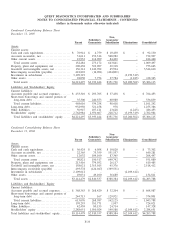
Year ended December 31,
2000 1999 1998 1997
Net income (loss) ............................................. $102,052 $ (3,413) $ 26,885 $ (22,260)
Add:
Amortization of goodwill, net of taxes .......................... 36,023 22,013 14,133 14,268
Provision for restructuring and other special charges, net of taxes ...... - 44,118 - 39,881
Loss on debt extinguishment, net of taxes ....................... 2,896 2,139 - -
Adjusted net income .......................................... $140,971 $ 64,857 $ 41,018 $ 31,889
Diluted earnings per common share
Reported diluted earnings per common share .................... $ 0.54 $ (0.02) $ 0.22 $ (0.19)
Adjusted diluted earnings per common share .................... $ 0.75 $ 0.45 $ 0.34 $ 0.27
Weighted average number of common shares
outstanding—diluted ......................................... 188,601 143,309 120,916 116,752
Reconciliation of Non-GAAP Measures