Quest Diagnostics 2005 Annual Report Download - page 68
Download and view the complete annual report
Please find page 68 of the 2005 Quest Diagnostics annual report below. You can navigate through the pages in the report by either clicking on the pages listed below, or by using the keyword search tool below to find specific information within the annual report.-
 1
1 -
2
-
3
-
4
-
5
-
6
-
7
-
8
-
9
-
10
-
11
-
12
-
13
-
14
-
15
-
16
-
17
-
18
-
19
-
20
-
21
-
22
-
23
-
24
-
25
-
26
-
27
-
28
-
29
-
30
-
31
-
32
-
33
-
34
-
35
-
36
-
37
-
38
-
39
-
40
-
41
-
42
-
43
-
44
-
45
-
46
-
47
-
48
-
49
-
50
-
51
-
52
-
53
-
54
-
55
-
56
-
57
-
 58
58 -
 59
59 -
 60
60 -
 61
61 -
 62
62 -
 63
63 -
 64
64 -
 65
65 -
 66
66 -
 67
67 -
 68
68 -
 69
69 -
 70
70 -
 71
71 -
 72
72 -
 73
73 -
 74
74 -
 75
75 -
 76
76 -
 77
77 -
 78
78 -
79
-
80
-
81
-
82
-
83
-
84
-
85
-
86
-
87
-
88
-
89
-
90
-
91
-
92
-
93
-
94
-
95
-
96
-
97
-
98
-
99
-
100
-
101
-
102
-
103
-
104
-
105
-
106
-
107
-
108
-
109
-
110
-
111
-
112
-
113
-
114
-
115
-
116
-
117
-
118
 |
 |
higher concentration of lower priced drugs-of-abuse testing, the acquisition of LabOne did not have a significant
impact on our average revenue per requisition. Management continues to expect that average revenue per
requisition will typically grow approximately 2% in a given year, with some fluctuations on a quarter-to-quarter
basis.
Our businesses other than clinical laboratory testing accounted for approximately 5% of our consolidated
net revenues in 2005. These businesses include our clinical trials testing business, and our healthcare
information technology business (MedPlus), whose growth rates did not significantly affect our consolidated
growth rate. In addition, we consider the risk assessment business acquired in the LabOne acquisition and NID
to be non-clinical laboratory testing businesses. As discussed elsewhere, NID’s net revenues were approximately
1% of consolidated net revenues in 2005; however, due to two product holds, NID’s net revenues were below
the prior year level, and reduced consolidated revenue growth by 0.2%. We expect that NID’s net revenues will
represent less than 1% of our consolidated net revenues in 2006. The risk assessment business currently
generates approximately $280 million in annual revenues and has been growing approximately 3% per year. The
net revenues from this business for the two months we owned it during 2005, contributed just under 1% to
consolidated revenue growth. We expect that this business will represent approximately 4% of our consolidated
net revenues in 2006, bringing the total net revenues attributable to our non-clinical laboratory testing businesses
to approximately 8% of our consolidated net revenues.
Operating Costs and Expenses
Total operating costs and expenses for the year ended December 31, 2005 increased $300 million from the
prior year period primarily due to organic growth in our clinical testing volume and, to a lesser degree, the
LabOne acquisition. The increased costs were primarily in the areas of employee compensation and benefits,
and testing supplies. While our cost structure has been favorably impacted by efficiencies generated from our
Six Sigma and standardization initiatives, we continue to make investments in sales, service, science and
information technology to further differentiate our company. These investments include:
•Expanding our sales force, particularly in high-growth specialty testing areas, and improved sales training
and sales tools;
•Continuously improving service levels and their consistency using Six Sigma;
•Making specimen collection more convenient for patients by adding phlebotomists and expanding hours
of operation in our patient service centers;
•Continuing to strengthen our medical and scientific capabilities by adding leading experts in various
disease states and emerging diagnostic areas; and
•Enhancing our information technology infrastructure and development capabilities supporting our products
which enable healthcare providers to order and receive laboratory test results, order prescriptions
electronically, and create, collect, manage and exchange healthcare information.
Additionally, costs incurred at NID associated with completing its quality review and cooperating with an
ongoing government investigation and regulatory review have served to increase operating costs over the prior
year and are impacting costs of services and selling, general and administrative expense as a percentage of net
revenues.
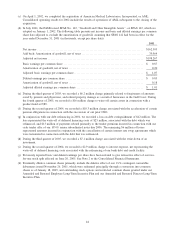
Cost of services, which includes the costs of obtaining, transporting and testing specimens, was 59.2% of
net revenues for the year ended December 31, 2005, increasing from 58.3% of net revenues in the prior year
period. The increase over the prior year is primarily due to the impact of NID’s results, and the addition of the
LabOne business, which carries a higher cost of sales percentage than the Company average. Also serving to
increase cost of services as a percentage of net revenues for the year is increased costs of testing supplies,
initial installation costs associated with deploying our Internet-based orders and results systems in physicians’
offices, and an increase in phlebotomists to support an increasing percentage of our volume collected in our
patient service centers and by phlebotomists we have in physicians’ offices. At December 31, 2005,
approximately 45% of our orders were being transmitted via the Internet. The increase in the number of orders
received through our Internet-based systems is (i) improving the initial collection of billing information which is
reducing the cost of billing and bad debt expense, both of which are components of selling, general and
administrative expenses, and (ii) reducing the cost associated with specimen processing, which is included in
cost of services.
Selling, general and administrative expenses, which include the costs of the sales force, billing operations,
bad debt expense and general management and administrative support, were 22.9% of net revenues during the
51