Quest Diagnostics 2005 Annual Report Download - page 72
Download and view the complete annual report
Please find page 72 of the 2005 Quest Diagnostics annual report below. You can navigate through the pages in the report by either clicking on the pages listed below, or by using the keyword search tool below to find specific information within the annual report.-
 1
1 -
2
-
3
-
4
-
5
-
6
-
7
-
8
-
9
-
10
-
11
-
12
-
13
-
14
-
15
-
16
-
17
-
18
-
19
-
20
-
21
-
22
-
23
-
24
-
25
-
26
-
27
-
28
-
29
-
30
-
31
-
32
-
33
-
34
-
35
-
36
-
37
-
38
-
39
-
40
-
41
-
42
-
43
-
44
-
45
-
46
-
47
-
48
-
49
-
50
-
51
-
52
-
53
-
54
-
55
-
56
-
57
-
58
-
59
-
60
-
61
-
 62
62 -
 63
63 -
 64
64 -
 65
65 -
 66
66 -
 67
67 -
 68
68 -
 69
69 -
 70
70 -
 71
71 -
 72
72 -
 73
73 -
 74
74 -
 75
75 -
 76
76 -
 77
77 -
 78
78 -
 79
79 -
 80
80 -
 81
81 -
 82
82 -
83
-
84
-
85
-
86
-
87
-
88
-
89
-
90
-
91
-
92
-
93
-
94
-
95
-
96
-
97
-
98
-
99
-
100
-
101
-
102
-
103
-
104
-
105
-
106
-
107
-
108
-
109
-
110
-
111
-
112
-
113
-
114
-
115
-
116
-
117
-
118
 |
 |
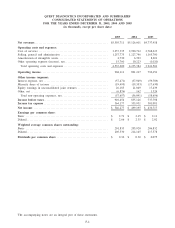
improvements were investments in our operations and a charge in the second quarter of 2004 of $10.3 million
associated with the succession of our prior CEO. This charge reduced operating income, as a percentage of net
revenues, by 0.2% for the year ended December 31, 2004.
Other Income (Expense)
Interest expense, net for the year ended December 31, 2004 decreased from the prior year period primarily
due to a reduction in borrowing costs associated with our 2004 refinancing. In addition, interest expense, net for
2004 included a $2.9 million second quarter charge representing the write-off of deferred financing costs
associated with the refinancing of our bank debt and credit facility. Our 2004 debt refinancing, which was done
to take advantage of the improved lending environment and our improved credit profile, is discussed further in
Note 10 to the Consolidated Financial Statements.
Other, net represents miscellaneous income and expense items related to non-operating activities such as
gains and losses associated with investments and other non-operating assets.
Quantitative and Qualitative Disclosures About Market Risk
We address our exposure to market risks, principally the market risk of changes in interest rates, through a
controlled program of risk management that may include the use of derivative financial instruments. In October
2005, we entered into interest rate lock agreements with two financial institutions for a total notional amount of
$300 million to lock the U.S. treasury bond rate component of a portion of our offering of debt securities later
that same month. We do not hold or issue derivative financial instruments for trading purposes. We do not
believe that our foreign exchange exposure is material to our financial condition or results of operations. See
Note 2 to the Consolidated Financial Statements for additional discussion of our financial instruments and
hedging activities. See Note 10 to the Consolidated Financial Statements for information regarding our treasury
lock agreements.
At December 31, 2005 and 2004, the fair value of our debt was estimated at approximately $1.6 billion
and $1.2 billion, respectively, using quoted market prices and yields for the same or similar types of
borrowings, taking into account the underlying terms of the debt instruments. At December 31, 2005 and 2004,
the estimated fair value exceeded the carrying value of the debt by approximately $39 million and $84 million,
respectively. An assumed 10% increase in interest rates (representing approximately 59 and 45 basis points at
December 31, 2005 and 2004, respectively) would potentially reduce the estimated fair value of our debt by
approximately $36 million and $17 million at December 31, 2005 and 2004, respectively.
Borrowings under our senior unsecured revolving credit facility, our secured receivables credit facility and
our term loan due December 2008, are subject to variable interest rates. Interest on our secured receivables
credit facility is based on rates that are intended to approximate commercial paper rates for highly rated issuers.
Interest rates on our senior unsecured revolving credit facility and term loan due December 2008 are subject to
a pricing schedule that can fluctuate based on changes in our credit ratings. As such, our borrowing cost under
these credit arrangements will be subject to both fluctuations in interest rates and changes in our credit ratings.
As of December 31, 2005, our borrowing rate for our LIBOR-based loans was LIBOR plus 0.5%. At
December 31, 2005, there was $60 million of borrowings outstanding under our $300 million secured
receivables credit facility, $75 million outstanding under our term loan due December 2008 and no borrowings
outstanding under our $500 million senior unsecured revolving credit facility. Based on our net exposure to
interest rate changes, an assumed 10% change in interest rates on our variable rate indebtedness (representing
approximately 44 basis points) would impact annual net interest expense by approximately $0.6 million,
assuming no changes to the debt outstanding at December 31, 2005. See Note 10 to the Consolidated Financial
Statements for details regarding our debt outstanding.
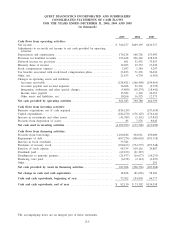
Liquidity and Capital Resources
Cash and Cash Equivalents
Cash and cash equivalents at December 31, 2005 totaled $92 million, compared to $73 million at
December 31, 2004. Cash flows from operating activities in 2005 were $852 million, which together with cash
flows from financing activities of $247 million, were used to fund investing activities of $1.1 billion. Cash and
cash equivalents at December 31, 2004 totaled $73 million, compared to $155 million at December 31, 2003.
Cash flows from operating activities in 2004 provided cash of $799 million, which together with cash on hand
55