Quest Diagnostics 2005 Annual Report Download - page 111
Download and view the complete annual report
Please find page 111 of the 2005 Quest Diagnostics annual report below. You can navigate through the pages in the report by either clicking on the pages listed below, or by using the keyword search tool below to find specific information within the annual report.-
 1
1 -
2
-
3
-
4
-
5
-
6
-
7
-
8
-
9
-
10
-
11
-
12
-
13
-
14
-
15
-
16
-
17
-
18
-
19
-
20
-
21
-
22
-
23
-
24
-
25
-
26
-
27
-
28
-
29
-
30
-
31
-
32
-
33
-
34
-
35
-
36
-
37
-
38
-
39
-
40
-
41
-
42
-
43
-
44
-
45
-
46
-
47
-
48
-
49
-
50
-
51
-
52
-
53
-
54
-
55
-
56
-
57
-
58
-
59
-
60
-
61
-
62
-
63
-
64
-
65
-
66
-
67
-
68
-
69
-
70
-
71
-
72
-
73
-
74
-
75
-
76
-
77
-
78
-
79
-
80
-
81
-
82
-
83
-
84
-
85
-
86
-
87
-
88
-
89
-
90
-
91
-
92
-
93
-
94
-
95
-
96
-
97
-
98
-
99
-
100
-
 101
101 -
 102
102 -
 103
103 -
 104
104 -
 105
105 -
 106
106 -
 107
107 -
 108
108 -
 109
109 -
 110
110 -
 111
111 -
 112
112 -
 113
113 -
 114
114 -
 115
115 -
 116
116 -
 117
117 -
 118
118
 |
 |

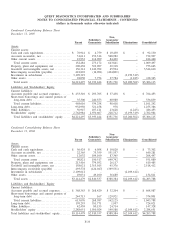
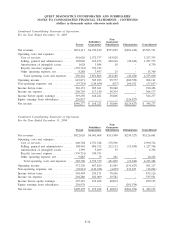
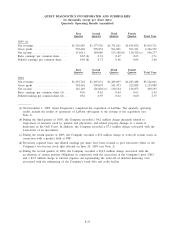
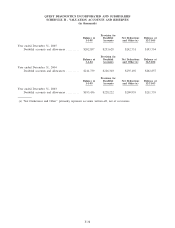
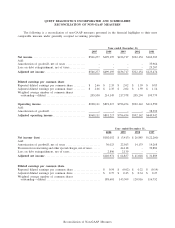
QUEST DIAGNOSTICS INCORPORATED AND SUBSIDIARIES
NOTES TO CONSOLIDATED FINANCIAL STATEMENTS - CONTINUED
(dollars in thousands unless otherwise indicated)
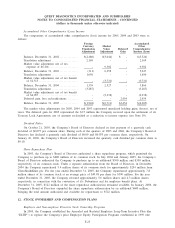
Condensed Consolidating Statement of Operations
For the Year Ended December 31, 2005
Non-
Subsidiary Guarantor
Parent Guarantors Subsidiaries Eliminations Consolidated
Net revenues ............................. $874,113 $4,356,819 $553,965 $(281,186) $5,503,711
Operating costs and expenses:
Cost of services ........................ 491,029 2,572,377 193,929 - 3,257,335
Selling, general and administrative ....... 102,040 916,153 260,216 (20,634) 1,257,775
Amortization of intangible assets......... 1,628 3,084 18 - 4,730
Royalty (income) expense ............... (352,743) 352,743 - - -
Other operating expense, net ............ 8,288 7,447 25 - 15,760
Total operating costs and expenses..... 250,242 3,851,804 454,188 (20,634) 4,535,600
Operating income ......................... 623,871 505,015 99,777 (260,552) 968,111
Non-operating expenses, net ............... (97,718) (219,654) (837) 260,552 (57,657)
Income before taxes ....................... 526,153 285,361 98,940 - 910,454
Income tax expense ....................... 206,703 117,140 40,334 - 364,177
Income before equity earnings ............. 319,450 168,221 58,606 - 546,277
Equity earnings from subsidiaries .......... 226,827 - - (226,827) -
Net income ............................... $546,277 $ 168,221 $ 58,606 $(226,827) $ 546,277
Condensed Consolidating Statement of Operations
For the Year Ended December 31, 2004
Non-
Subsidiary Guarantor
Parent Guarantors Subsidiaries Eliminations Consolidated
Net revenues ............................. $822,020 $4,041,608 $513,500 $(250,527) $5,126,601
Operating costs and expenses:
Cost of services ........................ 460,768 2,351,348 178,596 - 2,990,712
Selling, general and administrative ....... 108,401 886,332 252,113 (19,100) 1,227,746
Amortization of intangible assets......... 1,399 5,269 35 - 6,703
Royalty (income) expense ............... (330,751) 330,751 - - -
Other operating expense, net ............ 9,883 79 261 - 10,223
Total operating costs and expenses..... 249,700 3,573,779 431,005 (19,100) 4,235,384
Operating income ......................... 572,320 467,829 82,495 (231,427) 891,217
Non-operating expenses, net ............... (70,821) (212,658) (4,039) 231,427 (56,091)
Income before taxes ....................... 501,499 255,171 78,456 - 835,126
Income tax expense ....................... 204,280 102,069 29,582 - 335,931
Income before equity earnings ............. 297,219 153,102 48,874 - 499,195
Equity earnings from subsidiaries .......... 201,976 - - (201,976) -
Net income ............................... $499,195 $ 153,102 $ 48,874 $(201,976) $ 499,195
F-34