Quest Diagnostics 2005 Annual Report Download - page 81
Download and view the complete annual report
Please find page 81 of the 2005 Quest Diagnostics annual report below. You can navigate through the pages in the report by either clicking on the pages listed below, or by using the keyword search tool below to find specific information within the annual report.-
 1
1 -
2
-
3
-
4
-
5
-
6
-
7
-
8
-
9
-
10
-
11
-
12
-
13
-
14
-
15
-
16
-
17
-
18
-
19
-
20
-
21
-
22
-
23
-
24
-
25
-
26
-
27
-
28
-
29
-
30
-
31
-
32
-
33
-
34
-
35
-
36
-
37
-
38
-
39
-
40
-
41
-
42
-
43
-
44
-
45
-
46
-
47
-
48
-
49
-
50
-
51
-
52
-
53
-
54
-
55
-
56
-
57
-
58
-
59
-
60
-
61
-
62
-
63
-
64
-
65
-
66
-
67
-
68
-
69
-
70
-
 71
71 -
 72
72 -
 73
73 -
 74
74 -
 75
75 -
 76
76 -
 77
77 -
 78
78 -
 79
79 -
 80
80 -
 81
81 -
 82
82 -
 83
83 -
 84
84 -
 85
85 -
 86
86 -
 87
87 -
 88
88 -
 89
89 -
 90
90 -
 91
91 -
92
-
93
-
94
-
95
-
96
-
97
-
98
-
99
-
100
-
101
-
102
-
103
-
104
-
105
-
106
-
107
-
108
-
109
-
110
-
111
-
112
-
113
-
114
-
115
-
116
-
117
-
118
 |
 |

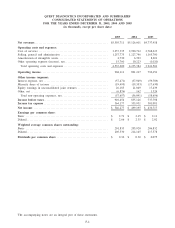
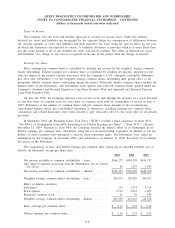
QUEST DIAGNOSTICS INCORPORATED AND SUBSIDIARIES
CONSOLIDATED STATEMENTS OF OPERATIONS
FOR THE YEARS ENDED DECEMBER 31, 2005, 2004 AND 2003
(in thousands, except per share data)
2005 2004 2003
Net revenues ........................................................ $5,503,711 $5,126,601 $4,737,958
Operating costs and expenses:
Cost of services ..................................................... 3,257,335 2,990,712 2,768,623
Selling, general and administrative .................................... 1,257,775 1,227,746 1,165,700
Amortization of intangible assets ...................................... 4,730 6,703 8,201
Other operating expense (income), net ................................. 15,760 10,223 (1,020)
Total operating costs and expenses .................................. 4,535,600 4,235,384 3,941,504
Operating income ................................................... 968,111 891,217 796,454
Other income (expense):
Interest expense, net ................................................. (57,471) (57,949) (59,789)
Minority share of income ............................................ (19,495) (19,353) (17,630)
Equity earnings in unconsolidated joint ventures ....................... 26,185 21,049 17,439
Other, net ........................................................... (6,876) 162 1,324
Total non-operating expenses, net ................................... (57,657) (56,091) (58,656)
Income before taxes ................................................. 910,454 835,126 737,798
Income tax expense ................................................. 364,177 335,931 301,081
Net income ......................................................... $ 546,277 $ 499,195 $ 436,717
Earnings per common share:
Basic ............................................................... $ 2.71 $ 2.45 $ 2.11
Diluted .............................................................. $ 2.66 $ 2.35 $ 2.02
Weighted average common shares outstanding:
Basic ............................................................... 201,833 203,920 206,832
Diluted .............................................................. 205,530 214,145 217,578
Dividends per common share ....................................... $ 0.36 $ 0.30 $ 0.075
The accompanying notes are an integral part of these statements.
F-4