Quest Diagnostics 2005 Annual Report Download - page 73
Download and view the complete annual report
Please find page 73 of the 2005 Quest Diagnostics annual report below. You can navigate through the pages in the report by either clicking on the pages listed below, or by using the keyword search tool below to find specific information within the annual report.-
 1
1 -
2
-
3
-
4
-
5
-
6
-
7
-
8
-
9
-
10
-
11
-
12
-
13
-
14
-
15
-
16
-
17
-
18
-
19
-
20
-
21
-
22
-
23
-
24
-
25
-
26
-
27
-
28
-
29
-
30
-
31
-
32
-
33
-
34
-
35
-
36
-
37
-
38
-
39
-
40
-
41
-
42
-
43
-
44
-
45
-
46
-
47
-
48
-
49
-
50
-
51
-
52
-
53
-
54
-
55
-
56
-
57
-
58
-
59
-
60
-
61
-
62
-
 63
63 -
 64
64 -
 65
65 -
 66
66 -
 67
67 -
 68
68 -
 69
69 -
 70
70 -
 71
71 -
 72
72 -
 73
73 -
 74
74 -
 75
75 -
 76
76 -
 77
77 -
 78
78 -
 79
79 -
 80
80 -
 81
81 -
 82
82 -
 83
83 -
84
-
85
-
86
-
87
-
88
-
89
-
90
-
91
-
92
-
93
-
94
-
95
-
96
-
97
-
98
-
99
-
100
-
101
-
102
-
103
-
104
-
105
-
106
-
107
-
108
-
109
-
110
-
111
-
112
-
113
-
114
-
115
-
116
-
117
-
118
 |
 |
were used to fund investing and financing activities, which required cash of $174 million and $707 million,
respectively.
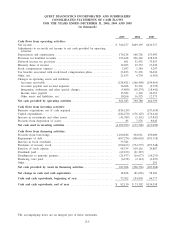
Cash Flows from Operating Activities
Net cash provided by operating activities for 2005 was $852 million compared to $799 million in the prior
year period. This increase was primarily due to improved operating performance and a smaller increase in net
accounts receivable compared to the prior year, partially offset by the timing and net amount of various
payments for taxes. Days sales outstanding, a measure of billing and collection efficiency, improved to 46 days
at December 31, 2005 from 47 days at December 31, 2004.
Net cash provided by operating activities for 2004 was $799 million compared to $663 million in the prior
year period. This increase was primarily due to improved operating performance and increased tax benefits
associated with stock-based compensation plans, partially offset by an increase in accounts receivable associated
with growth in net revenues. Days sales outstanding, a measure of billing and collection efficiency, improved to
47 days at December 31, 2004 from 48 days at December 31, 2003.
Cash Flows from Investing Activities
Net cash used in investing activities in 2005 was $1.1 billion, consisting primarily of the acquisition of
LabOne and related transaction costs for $795 million, the acquisition of a small regional laboratory for $19
million, equity investments of $38 million in companies which develop diagnostic tests, and capital expenditures
of $224 million.
Net cash used in investing activities in 2004 was $174 million, consisting primarily of capital expenditures
of $176 million.
Cash Flows from Financing Activities
Net cash provided by financing activities in 2005 was $247 million, consisting primarily of proceeds from
borrowings of $1.1 billion and $98 million in proceeds from the exercise of stock options, reduced by
repayments of debt totaling $497 million, purchases of treasury stock totaling $390 million and dividend
payments of $70 million. Proceeds from borrowings consisted primarily of $892 million net proceeds from the
private placement of $900 million of senior notes, or the 2005 Senior Notes, used to finance the acquisition of
LabOne and $200 million of borrowings under our secured receivable credit facility to fund the repayment of
$100 million of principal outstanding under our senior unsecured revolving credit facility and seasonal cash flow
requirements. During 2005, we repaid $270 million of borrowings associated with our secured receivables credit
facility and $100 million of principal outstanding under our senior unsecured revolving credit facility. In
addition, we repaid approximately $127 million of principal, representing substantially all of LabOne’s
outstanding debt that was assumed by us in connection with the LabOne acquisition. At December 31, 2005,
we had $60 million outstanding, and $740 million of available borrowing capacity under our combined credit
facilities. Our credit facilities and the 2005 Senior Notes, along with our other debt outstanding are more fully
described in Note 10 to the Consolidated Financial Statements. The $390 million in treasury stock purchases
represents 7.8 million shares of our common stock purchased at an average price of $49.98 per share.
Net cash used in financing activities in 2004 was $707 million, consisting primarily of purchases of
treasury stock totaling $735 million and dividend payments totaling $61 million, partially offset by $109 million
received from the exercise of stock options. In addition, we repaid the remaining $305 million of principal
outstanding under our term loan due June 2007 with $100 million of borrowings under our senior unsecured
revolving credit facility, $130 million of borrowings under our secured receivables credit facility and $75 million
of borrowings under our term loan due December 2008. The $735 million in treasury stock purchases represents
16.7 million shares of our common stock purchased at an average price of $44.11 per share.
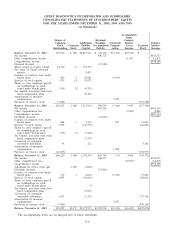
Stock Split
On June 20, 2005, the Company effected a two-for-one stock split through the issuance of a stock dividend
of one new share of common stock for each share of common stock held by stockholders of record on June 6,
2005. References to previously reported number of common shares and per common share amounts including
earnings per common share calculations and related disclosures, have been restated to give retroactive effect to
the stock split for all periods presented.
56