Quest Diagnostics 2005 Annual Report Download - page 82
Download and view the complete annual report
Please find page 82 of the 2005 Quest Diagnostics annual report below. You can navigate through the pages in the report by either clicking on the pages listed below, or by using the keyword search tool below to find specific information within the annual report.-
 1
1 -
2
-
3
-
4
-
5
-
6
-
7
-
8
-
9
-
10
-
11
-
12
-
13
-
14
-
15
-
16
-
17
-
18
-
19
-
20
-
21
-
22
-
23
-
24
-
25
-
26
-
27
-
28
-
29
-
30
-
31
-
32
-
33
-
34
-
35
-
36
-
37
-
38
-
39
-
40
-
41
-
42
-
43
-
44
-
45
-
46
-
47
-
48
-
49
-
50
-
51
-
52
-
53
-
54
-
55
-
56
-
57
-
58
-
59
-
60
-
61
-
62
-
63
-
64
-
65
-
66
-
67
-
68
-
69
-
70
-
71
-
 72
72 -
 73
73 -
 74
74 -
 75
75 -
 76
76 -
 77
77 -
 78
78 -
 79
79 -
 80
80 -
 81
81 -
 82
82 -
 83
83 -
 84
84 -
 85
85 -
 86
86 -
 87
87 -
 88
88 -
 89
89 -
 90
90 -
 91
91 -
 92
92 -
93
-
94
-
95
-
96
-
97
-
98
-
99
-
100
-
101
-
102
-
103
-
104
-
105
-
106
-
107
-
108
-
109
-
110
-
111
-
112
-
113
-
114
-
115
-
116
-
117
-
118
 |
 |

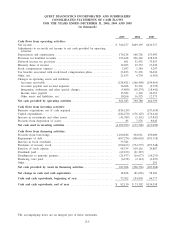
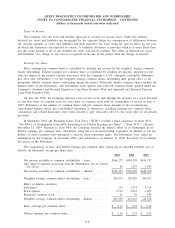
QUEST DIAGNOSTICS INCORPORATED AND SUBSIDIARIES
CONSOLIDATED STATEMENTS OF CASH FLOWS
FOR THE YEARS ENDED DECEMBER 31, 2005, 2004 AND 2003
(in thousands)
2005 2004 2003
Cash flows from operating activities:
Net income ............................................................. $ 546,277 $499,195 $436,717
Adjustments to reconcile net income to net cash provided by operating
activities:
Depreciation and amortization ............................................ 176,124 168,726 153,903
Provision for doubtful accounts .......................................... 233,628 226,310 228,222
Deferred income tax provision ........................................... 661 52,451 33,853
Minority share of income ................................................ 19,495 19,353 17,630
Stock compensation expense ............................................. 2,037 1,384 5,297
Tax benefits associated with stock-based compensation plans ............... 33,823 71,276 30,496
Other, net............................................................... 21,673 4,739 (1,583)
Changes in operating assets and liabilities:
Accounts receivable ................................................... (238,421) (266,404) (254,865)
Accounts payable and accrued expenses ................................ 36,038 22,336 (6,795)
Integration, settlement and other special charges......................... (5,400) (18,274) (18,942)
Income taxes payable ................................................. 15,382 1,163 26,493
Other assets and liabilities, net ......................................... 10,266 16,525 12,373
Net cash provided by operating activities ............................... 851,583 798,780 662,799
Cash flows from investing activities:
Business acquisitions, net of cash acquired ................................ (814,219) - (237,610)
Capital expenditures ..................................................... (224,270) (176,125) (174,641)
Increase in investments and other assets .................................. (41,389) (5,151) (13,842)
Proceeds from disposition of assets ....................................... 85 7,576 9,043
Net cash used in investing activities .................................... (1,079,793) (173,700) (417,050)
Cash flows from financing activities:
Proceeds from borrowings ............................................... 1,100,186 304,921 450,000
Repayments of debt ..................................................... (497,276) (306,018) (391,718)
Increase in book overdrafts .............................................. 33,384 - -
Purchases of treasury stock .............................................. (390,163) (734,577) (257,548)
Exercise of stock options ................................................ 98,335 109,116 29,887
Dividends paid .......................................................... (69,673) (61,387) -
Distributions to minority partners ......................................... (21,477) (16,677) (14,253)
Financing costs paid ..................................................... (6,278) (2,114) (4,227)
Other ................................................................... - - 291
Net cash provided by (used in) financing activities ...................... 247,038 (706,736) (187,568)
Net change in cash and cash equivalents ............................... 18,828 (81,656) 58,181
Cash and cash equivalents, beginning of year ........................... 73,302 154,958 96,777
Cash and cash equivalents, end of year ................................ $ 92,130 $ 73,302 $154,958
The accompanying notes are an integral part of these statements.
F-5