Quest Diagnostics 2005 Annual Report Download - page 71
Download and view the complete annual report
Please find page 71 of the 2005 Quest Diagnostics annual report below. You can navigate through the pages in the report by either clicking on the pages listed below, or by using the keyword search tool below to find specific information within the annual report.-
 1
1 -
2
-
3
-
4
-
5
-
6
-
7
-
8
-
9
-
10
-
11
-
12
-
13
-
14
-
15
-
16
-
17
-
18
-
19
-
20
-
21
-
22
-
23
-
24
-
25
-
26
-
27
-
28
-
29
-
30
-
31
-
32
-
33
-
34
-
35
-
36
-
37
-
38
-
39
-
40
-
41
-
42
-
43
-
44
-
45
-
46
-
47
-
48
-
49
-
50
-
51
-
52
-
53
-
54
-
55
-
56
-
57
-
58
-
59
-
60
-
 61
61 -
 62
62 -
 63
63 -
 64
64 -
 65
65 -
 66
66 -
 67
67 -
 68
68 -
 69
69 -
 70
70 -
 71
71 -
 72
72 -
 73
73 -
 74
74 -
 75
75 -
 76
76 -
 77
77 -
 78
78 -
 79
79 -
 80
80 -
 81
81 -
82
-
83
-
84
-
85
-
86
-
87
-
88
-
89
-
90
-
91
-
92
-
93
-
94
-
95
-
96
-
97
-
98
-
99
-
100
-
101
-
102
-
103
-
104
-
105
-
106
-
107
-
108
-
109
-
110
-
111
-
112
-
113
-
114
-
115
-
116
-
117
-
118
 |
 |
in the areas of employee compensation and benefits and testing supplies. While our cost structure has been
favorably impacted by efficiencies generated from our Six Sigma and standardization initiatives, we continue to
make investments in sales, service, science and information technology to further differentiate our company.
These investments include:
•Expanding our sales force, particularly in high-growth specialty testing areas, and improved sales training
and sales tools;
•Continuously improving service levels and their consistency using Six Sigma;
•Making specimen collection more convenient for patients by adding phlebotomists and expanding hours
of operation in our patient service centers;
•Continuing to strengthen our medical and scientific capabilities by adding leading experts in various
disease states and emerging diagnostic areas; and
•Enhancing our information technology infrastructure and development capabilities supporting our products
which enable healthcare providers to order and receive laboratory test results, order prescriptions
electronically, and create, collect, manage and exchange healthcare information.
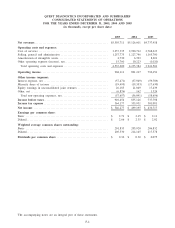
Cost of services, which includes the costs of obtaining, transporting and testing specimens, was 58.3% of
net revenues for the year ended December 31, 2004, decreasing from 58.4% of net revenues in the prior year
period. This improvement was primarily the result of the increase in average revenue per requisition and
efficiency gains resulting from our Six Sigma and standardization initiatives. This improvement was partially
offset by initial installation costs associated with deploying our Internet-based orders and results systems in
physicians’ offices and an increase in the number of phlebotomists in our patient service centers to support an
increasing percentage of our volume generated from these sites. At December 31, 2004, approximately 40% of
our orders and 60% of our test results were being transmitted via the Internet. The increase in the number of
orders and test results reported via our Internet-based systems is improving the initial collection of billing
information which is reducing the cost of billing and bad debt expense, both of which are components of
selling, general and administrative expenses. Additionally, we believe that the number of physicians who no
longer draw blood in their offices continues to increase, which is resulting in an increase in the number of
blood draws in our patient service centers and by our phlebotomists placed in physicians’ offices. This shift has
increased our operating costs associated with our blood draws, but is reducing costs in accessioning and other
parts of our operations due to improved billing information, and a reduction in the number of inadequate patient
samples because our phlebotomists are specifically trained in these areas.
Selling, general and administrative expenses, which include the costs of the sales force, billing operations,
bad debt expense and general management and administrative support, was 23.9% of net revenues during the
year ended December 31, 2004, decreasing from 24.6% in the prior year period. This improvement was
primarily due to efficiencies from our Six Sigma and standardization initiatives and the improvement in average
revenue per requisition. Partially offsetting these improvements are additional costs for expanding our sales force
and enhancing their training. During 2004, bad debt expense improved to 4.4% of net revenues, compared to
4.8% in the prior year period. This decrease primarily relates to the improved collection of diagnosis, patient
and insurance information necessary to more effectively bill for services performed. We believe that our Six
Sigma and standardization initiatives and the increased use of electronic ordering by our customers will provide
additional opportunities to further improve our overall collection experience and cost structure.
Other operating expense (income), net represents miscellaneous income and expense items related to
operating activities, including gains and losses associated with the disposal of operating assets. For the year
ended December 31, 2004, other operating expense (income), net includes a $10.3 million second quarter charge
associated with the acceleration of certain pension obligations in connection with the succession of our prior
CEO. For the year ended December 31, 2003, other operating expense (income), net includes $3.3 million of
gains on the sale of certain operating assets, partially offset by a $1.1 million charge associated with the
integration of Unilab.
Operating Income
Operating income for the year ended December 31, 2004 improved to $891 million, or 17.4% of net
revenues, from $796 million, or 16.8% of net revenues, in the prior year period. The increase in operating
income for the year ended December 31, 2004 was principally driven by revenue growth and efficiencies
generated from our Six Sigma and standardization initiatives, which have reduced both the cost of services and
selling, general and administrative expenses as a percentage of net revenues. Partially offsetting these
54