Quest Diagnostics 2005 Annual Report Download - page 2
Download and view the complete annual report
Please find page 2 of the 2005 Quest Diagnostics annual report below. You can navigate through the pages in the report by either clicking on the pages listed below, or by using the keyword search tool below to find specific information within the annual report.-
 1
1 -
 2
2 -
 3
3 -
 4
4 -
 5
5 -
 6
6 -
 7
7 -
 8
8 -
 9
9 -
 10
10 -
 11
11 -
 12
12 -
 13
13 -
14
-
15
-
16
-
17
-
18
-
19
-
20
-
21
-
22
-
23
-
24
-
25
-
26
-
27
-
28
-
29
-
30
-
31
-
32
-
33
-
34
-
35
-
36
-
37
-
38
-
39
-
40
-
41
-
42
-
43
-
44
-
45
-
46
-
47
-
48
-
49
-
50
-
51
-
52
-
53
-
54
-
55
-
56
-
57
-
58
-
59
-
60
-
61
-
62
-
63
-
64
-
65
-
66
-
67
-
68
-
69
-
70
-
71
-
72
-
73
-
74
-
75
-
76
-
77
-
78
-
79
-
80
-
81
-
82
-
83
-
84
-
85
-
86
-
87
-
88
-
89
-
90
-
91
-
92
-
93
-
94
-
95
-
96
-
97
-
98
-
99
-
100
-
101
-
102
-
103
-
104
-
105
-
106
-
107
-
108
-
109
-
110
-
111
-
112
-
113
-
114
-
115
-
116
-
117
-
118
 |
 |
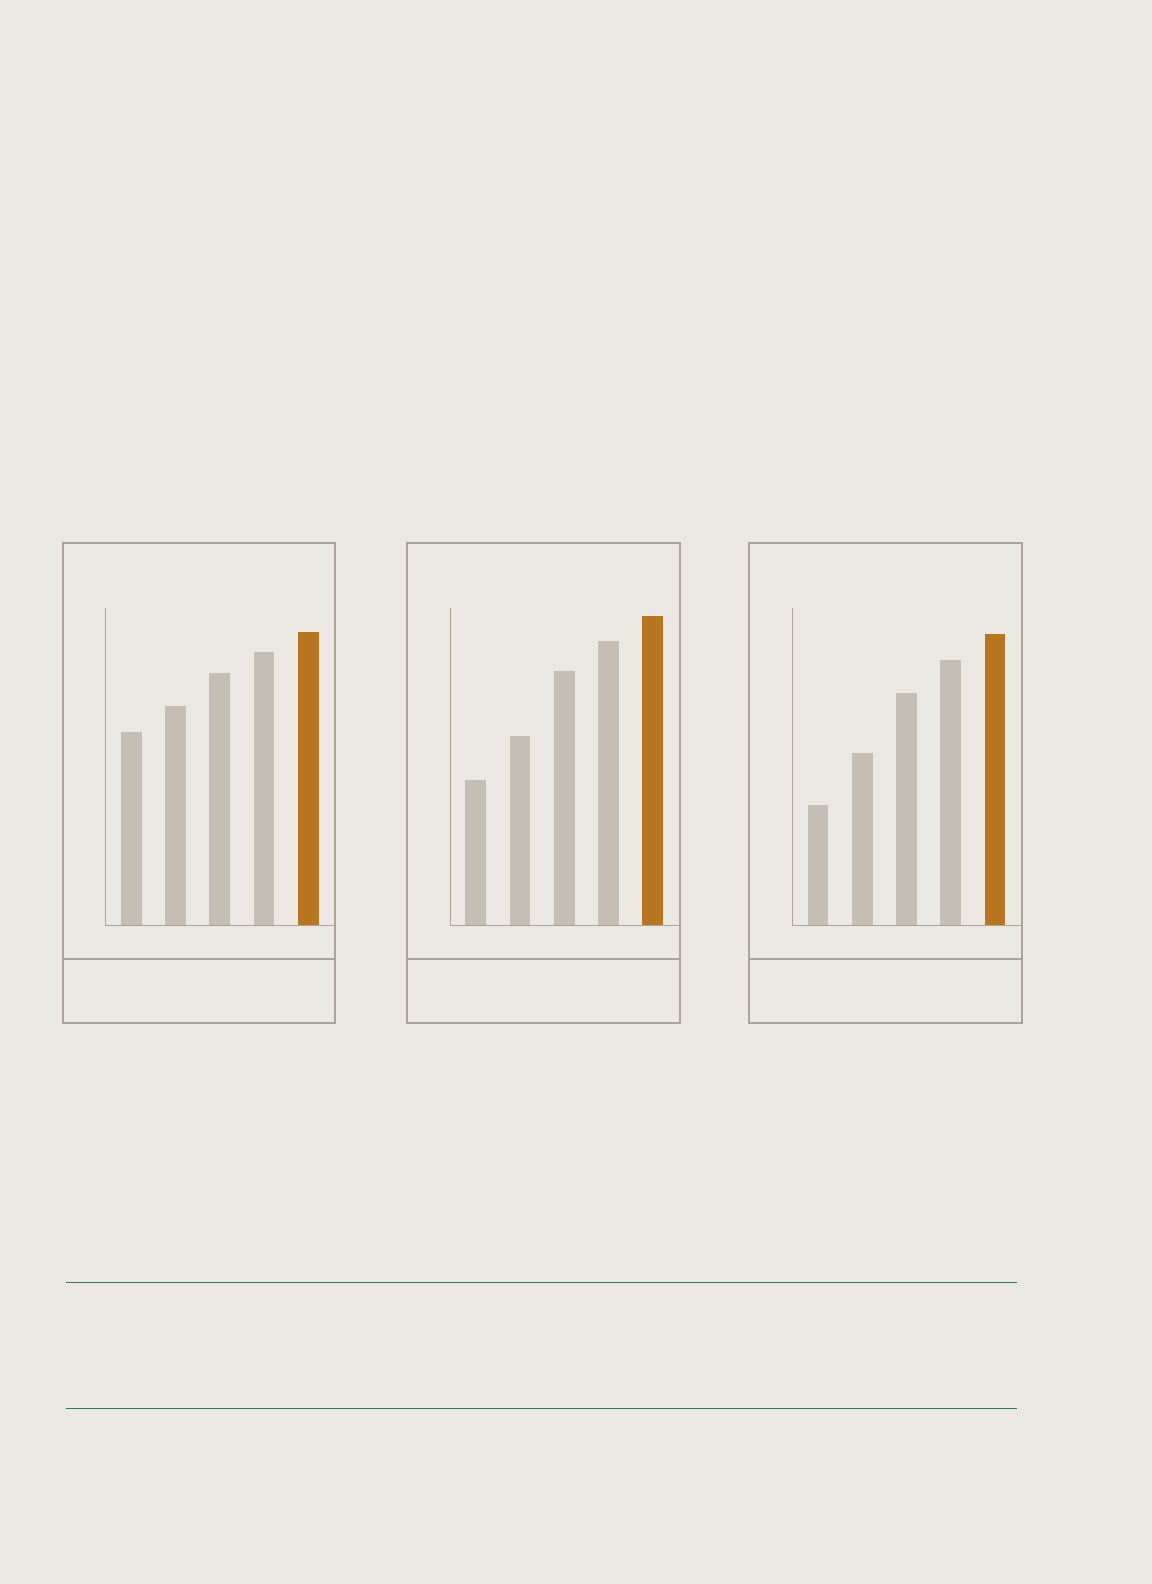
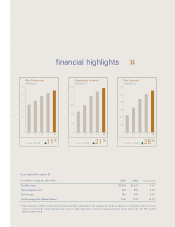
2005 2004 %Increase
NetRevenues $5,504 $5,127 7.4%
OperatingIncome 968 891 8.6%
NetIncome 546 499 9.4%
NetEarningsPerDilutedShare 2.66 2.35 13.2%
*Thesemeasures,for2001,excludespecialchargesandreflectadjustmentforthechangeingoodwillaccounting.Areconciliationofthesemeasures
and the most directly comparable financial measures under generally accepted accounting principles can be found after the 2005 Annual
ReportonForm10-K.
YearsEndedDecember31
(inmillions,exceptpersharedata)
01 02 03 04 05 01 02 03 04 05 01 02 03 04 05
6.0
5.0
4.0
3.0
2.0
1.0
0
1,000
800
600
400
200
0
600
500
400
300
200
100
0
($ billions)
($ millions)
($ millions)
�25%
�21%
�11%
5-year CAGR 5-year CAGR 5-year CAGR
0
1000
2000
3000
4000
5000
6000
0
200
400
600
800
1000
0
100
200
300
400
500
600
0
1000000
2000000
3000000
4000000
5000000
6000000
financialhighlights »