Pottery Barn 2013 Annual Report Download - page 70
Download and view the complete annual report
Please find page 70 of the 2013 Pottery Barn annual report below. You can navigate through the pages in the report by either clicking on the pages listed below, or by using the keyword search tool below to find specific information within the annual report.-
 1
1 -
2
-
3
-
4
-
5
-
6
-
7
-
8
-
9
-
10
-
11
-
12
-
13
-
14
-
15
-
16
-
17
-
18
-
19
-
20
-
21
-
22
-
23
-
24
-
25
-
26
-
27
-
28
-
29
-
30
-
31
-
32
-
33
-
34
-
35
-
36
-
37
-
38
-
39
-
40
-
41
-
42
-
43
-
44
-
45
-
46
-
47
-
48
-
49
-
50
-
51
-
52
-
53
-
54
-
55
-
56
-
57
-
58
-
59
-
 60
60 -
 61
61 -
 62
62 -
 63
63 -
 64
64 -
 65
65 -
 66
66 -
 67
67 -
 68
68 -
 69
69 -
 70
70 -
 71
71 -
 72
72 -
 73
73 -
 74
74 -
 75
75 -
 76
76 -
 77
77 -
 78
78 -
 79
79 -
 80
80 -
81
-
82
-
83
-
84
-
85
-
86
-
87
-
88
-
89
-
90
-
91
-
92
-
93
-
94
-
95
-
96
-
97
-
98
-
99
-
100
-
101
-
102
-
103
-
104
-
105
-
106
-
107
-
108
-
109
-
110
-
111
-
112
-
113
-
114
-
115
-
116
-
117
-
118
-
119
-
120
-
121
-
122
-
123
-
124
-
125
-
126
-
127
-
128
-
129
-
130
-
131
-
132
-
133
-
134
-
135
-
136
-
137
-
138
-
139
-
140
-
141
-
142
-
143
-
144
-
145
-
146
-
147
-
148
-
149
-
150
-
151
-
152
-
153
-
154
-
155
-
156
 |
 |

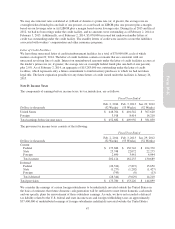
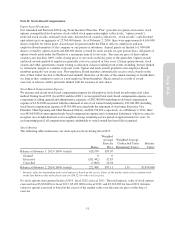
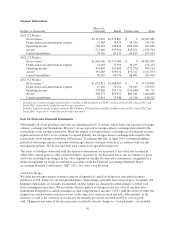
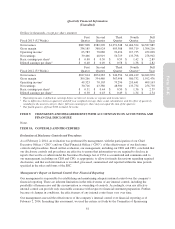
Segment Information
Dollars in thousands
Direct-to-
Customer Retail Unallocated Total
2013 (52 Weeks)
Net revenues1$2,115,022 $2,272,867 $ 0 $4,387,889
Depreciation and amortization expense 25,588 78,423 45,784 149,795
Operating income 502,143 248,894 (298,939) 452,098
Assets2517,086 975,994 843,654 2,336,734
Capital expenditures 38,195 89,331 66,427 193,953
2012 (53 Weeks)
Net revenues1$1,869,386 $2,173,484 $ 0 $4,042,870
Depreciation and amortization expense 23,164 72,994 38,295 134,453
Operating income 418,836 262,899 (272,572) 409,163
Assets2397,285 939,672 850,722 2,187,679
Capital expenditures 30,585 86,776 88,043 205,404
2011 (52 Weeks)
Net revenues1$1,632,811 $2,088,084 $ 0 $3,720,895
Depreciation and amortization expense 19,626 76,914 34,013 130,553
Operating income 359,596 263,776 (241,640) 381,732
Assets2340,573 859,879 860,386 2,060,838
Capital expenditures 27,451 51,546 51,356 130,353
1Includes net revenues of approximately $215.5 million, $166.6 million and $140.1 million in fiscal 2013, fiscal 2012 and
fiscal 2011, respectively, related to our foreign operations.
2Includes long-term assets of approximately $61.4 million, $42.6 million and $24.1 million in fiscal 2013, fiscal 2012 and
fiscal 2011, respectively, related to our foreign operations.
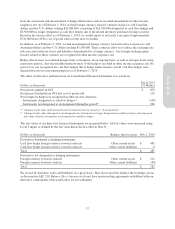
Note M: Derivative Financial Instruments
Substantially all of our purchases and sales are denominated in U.S. dollars, which limits our exposure to foreign
currency exchange rate fluctuations. However, we are exposed to foreign currency exchange risk related to the
transactions of our foreign subsidiaries. While the impact of foreign currency exchange rate fluctuations was not
significant in fiscal 2013, as we continue to expand globally, the foreign currency exchange risk related to the
transactions of our foreign subsidiaries will increase. To mitigate this risk, in April 2013, we began hedging a
portion of our foreign currency exposure with foreign currency forward contracts in accordance with our risk
management policies. We do not enter into such contracts for speculative purposes.
The assets or liabilities associated with the derivative instruments are measured at fair value and recorded in
either other current assets or other current liabilities, respectively. As discussed below, the accounting for gains
and losses resulting from changes in fair value depends on whether the derivative instrument is designated as a
hedge and qualifies for hedge accounting in accordance with the Financial Accounting Standards Board
Accounting Standard Codification (“ASC”) 815, Derivatives and Hedging.
Cash Flow Hedges
We enter into foreign currency forward contracts designated as cash flow hedges for forecasted inventory
purchases in U.S. dollars by our foreign subsidiaries. These hedges generally have terms of up to 12 months. All
hedging relationships are formally documented, and the hedges are designed to offset changes to future cash
flows on hedged transactions. We record the effective portion of changes in the fair value of our derivative
instruments designated as cash flow hedges in other comprehensive income (“OCI”) until the earlier of either the
hedged forecasted inventory purchase occurs or the respective contracts reach maturity. Subsequently, as the
inventory is sold to the customer, we reclassify the amounts previously recorded in OCI to cost of goods
sold. Changes in fair value of the forward contract related to interest charges or “forward points” are excluded
56