Pottery Barn 2013 Annual Report Download - page 43
Download and view the complete annual report
Please find page 43 of the 2013 Pottery Barn annual report below. You can navigate through the pages in the report by either clicking on the pages listed below, or by using the keyword search tool below to find specific information within the annual report.-
 1
1 -
2
-
3
-
4
-
5
-
6
-
7
-
8
-
9
-
10
-
11
-
12
-
13
-
14
-
15
-
16
-
17
-
18
-
19
-
20
-
21
-
22
-
23
-
24
-
25
-
26
-
27
-
28
-
29
-
30
-
31
-
32
-
 33
33 -
 34
34 -
 35
35 -
 36
36 -
 37
37 -
 38
38 -
 39
39 -
 40
40 -
 41
41 -
 42
42 -
 43
43 -
 44
44 -
 45
45 -
 46
46 -
 47
47 -
 48
48 -
 49
49 -
 50
50 -
 51
51 -
 52
52 -
 53
53 -
54
-
55
-
56
-
57
-
58
-
59
-
60
-
61
-
62
-
63
-
64
-
65
-
66
-
67
-
68
-
69
-
70
-
71
-
72
-
73
-
74
-
75
-
76
-
77
-
78
-
79
-
80
-
81
-
82
-
83
-
84
-
85
-
86
-
87
-
88
-
89
-
90
-
91
-
92
-
93
-
94
-
95
-
96
-
97
-
98
-
99
-
100
-
101
-
102
-
103
-
104
-
105
-
106
-
107
-
108
-
109
-
110
-
111
-
112
-
113
-
114
-
115
-
116
-
117
-
118
-
119
-
120
-
121
-
122
-
123
-
124
-
125
-
126
-
127
-
128
-
129
-
130
-
131
-
132
-
133
-
134
-
135
-
136
-
137
-
138
-
139
-
140
-
141
-
142
-
143
-
144
-
145
-
146
-
147
-
148
-
149
-
150
-
151
-
152
-
153
-
154
-
155
-
156
 |
 |

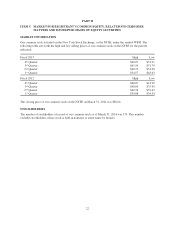
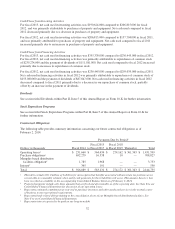
Fiscal 2013 Fiscal 2012 Fiscal 2011
Store
Count
Avg. LSF
Per Store
Store
Count
Avg. LSF
Per Store
Store
Count
Avg. LSF
Per Store
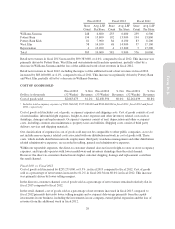
Williams-Sonoma 248 6,600 253 6,600 259 6,500
Pottery Barn 194 13,800 192 13,900 194 13,800
Pottery Barn Kids 81 7,900 84 8,100 83 8,200
West Elm 58 14,100 48 14,900 37 17,100
Rejuvenation 4 13,200 4 13,200 3 17,200
Total 585 10,000 581 9,900 576 10,000
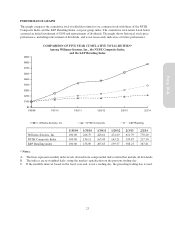
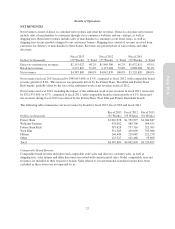
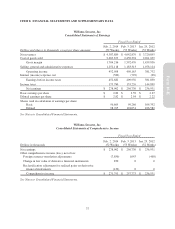
Retail net revenues in fiscal 2013 increased by $99,383,000, or 4.6%, compared to fiscal 2012. This increase was
primarily driven by Pottery Barn, West Elm and our international franchise operations, partially offset by a
decrease in Williams-Sonoma and the loss of the additional week of net revenues in fiscal 2012.
Retail net revenues in fiscal 2012, including the impact of the additional week of net revenues in fiscal 2012,
increased by $85,400,000, or 4.1%, compared to fiscal 2011. This increase was primarily driven by Pottery Barn
and West Elm, partially offset by a decrease in Williams-Sonoma.
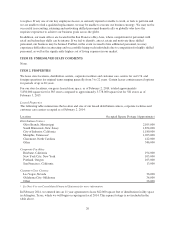
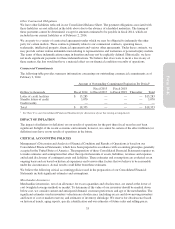
COST OF GOODS SOLD
Dollars in thousands
Fiscal 2013
(52 Weeks)
% Net
Revenues
Fiscal 2012
(53 Weeks)
% Net
Revenues
Fiscal 2011
(52 Weeks)
% Net
Revenues
Cost of goods sold1$2,683,673 61.2% $2,450,394 60.6% $2,261,039 60.8%
1Includes total occupancy expenses of $561,586,000, $517,300,000 and $500,660,000 in fiscal 2013, fiscal 2012 and fiscal
2011, respectively.
Cost of goods sold includes cost of goods, occupancy expenses and shipping costs. Cost of goods consists of cost
of merchandise, inbound freight expenses, freight-to-store expenses and other inventory related costs such as
shrinkage, damages and replacements. Occupancy expenses consist of rent, depreciation and other occupancy
costs, including common area maintenance, property taxes and utilities. Shipping costs consist of third party
delivery services and shipping materials.
Our classification of expenses in cost of goods sold may not be comparable to other public companies, as we do
not include non-occupancy related costs associated with our distribution network in cost of goods sold. These
costs, which include distribution network employment, third party warehouse management and other distribution
related administrative expenses, are recorded in selling, general and administrative expenses.
Within our reportable segments, the direct-to-customer channel does not incur freight-to-store or store occupancy
expenses, and typically operates with lower markdowns and inventory shrinkage than the retail channel.
However, the direct-to-customer channel incurs higher customer shipping, damage and replacement costs than
the retail channel.
Fiscal 2013 vs. Fiscal 2012
Cost of goods sold increased by $233,279,000, or 9.5%, in fiscal 2013 compared to fiscal 2012. Cost of goods
sold as a percentage of net revenues increased to 61.2% in fiscal 2013 from 60.6% in fiscal 2012. This increase
was primarily driven by lower selling margins.
In the direct-to-customer channel, cost of goods sold as a percentage of net revenues remained relatively flat in
fiscal 2013 compared to fiscal 2012.
In the retail channel, cost of goods sold as a percentage of net revenues increased in fiscal 2013 compared to
fiscal 2012 primarily driven by lower selling margins and occupancy deleverage primarily from the capital
investments in our business, including the investments in our company-owned global expansion and the loss of
revenues from the additional week in fiscal 2012.
29
Form 10-K