Pottery Barn 2013 Annual Report Download - page 46
Download and view the complete annual report
Please find page 46 of the 2013 Pottery Barn annual report below. You can navigate through the pages in the report by either clicking on the pages listed below, or by using the keyword search tool below to find specific information within the annual report.-
 1
1 -
2
-
3
-
4
-
5
-
6
-
7
-
8
-
9
-
10
-
11
-
12
-
13
-
14
-
15
-
16
-
17
-
18
-
19
-
20
-
21
-
22
-
23
-
24
-
25
-
26
-
27
-
28
-
29
-
30
-
31
-
32
-
33
-
34
-
35
-
 36
36 -
 37
37 -
 38
38 -
 39
39 -
 40
40 -
 41
41 -
 42
42 -
 43
43 -
 44
44 -
 45
45 -
 46
46 -
 47
47 -
 48
48 -
 49
49 -
 50
50 -
 51
51 -
 52
52 -
 53
53 -
 54
54 -
 55
55 -
 56
56 -
57
-
58
-
59
-
60
-
61
-
62
-
63
-
64
-
65
-
66
-
67
-
68
-
69
-
70
-
71
-
72
-
73
-
74
-
75
-
76
-
77
-
78
-
79
-
80
-
81
-
82
-
83
-
84
-
85
-
86
-
87
-
88
-
89
-
90
-
91
-
92
-
93
-
94
-
95
-
96
-
97
-
98
-
99
-
100
-
101
-
102
-
103
-
104
-
105
-
106
-
107
-
108
-
109
-
110
-
111
-
112
-
113
-
114
-
115
-
116
-
117
-
118
-
119
-
120
-
121
-
122
-
123
-
124
-
125
-
126
-
127
-
128
-
129
-
130
-
131
-
132
-
133
-
134
-
135
-
136
-
137
-
138
-
139
-
140
-
141
-
142
-
143
-
144
-
145
-
146
-
147
-
148
-
149
-
150
-
151
-
152
-
153
-
154
-
155
-
156
 |
 |

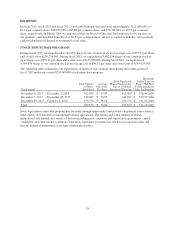
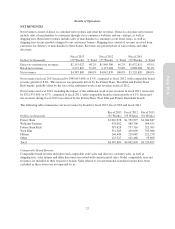
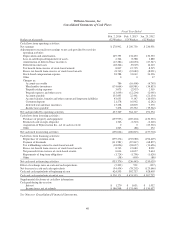
Cash Flows from Investing Activities
For fiscal 2013, net cash used in investing activities was $190,624,000 compared to $206,815,000 for fiscal
2012, and was primarily attributable to purchases of property and equipment. Net cash used compared to fiscal
2012 decreased primarily due to a decrease in purchases of property and equipment.
For fiscal 2012, net cash used in investing activities was $206,815,000 compared to $157,704,000 in fiscal 2011,
and was primarily attributable to purchases of property and equipment. Net cash used compared to fiscal 2011
increased primarily due to an increase in purchases of property and equipment.
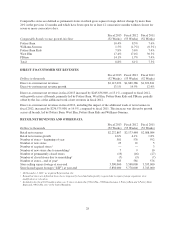
Cash Flows from Financing Activities
For fiscal 2013, net cash used in financing activities was $355,376,000 compared to $236,445,000 in fiscal 2012.
For fiscal 2013, net cash used in financing activities was primarily attributable to repurchases of common stock
of $239,274,000 and the payment of dividends of $111,581,000. Net cash used compared to fiscal 2012 increased
primarily due to increases in repurchases of common stock.
For fiscal 2012, net cash used in financing activities was $236,445,000 compared to $259,039,000 in fiscal 2011.
Net cash used in financing activities in fiscal 2012 was primarily attributable to repurchases of common stock of
$155,080,000 and the payment of dividends of $87,847,000. Net cash used in financing activities in fiscal 2012
decreased compared to fiscal 2011 primarily due to a decrease in our repurchase of common stock, partially
offset by an increase in the payment of dividends.
Dividends
See section titled Dividends within Part II, Item 5 of this Annual Report on Form 10-K for further information.
Stock Repurchase Programs
See section titled Stock Repurchase Programs within Part II, Item 5 of this Annual Report on Form 10-K for
further information.
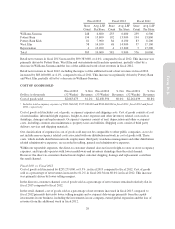
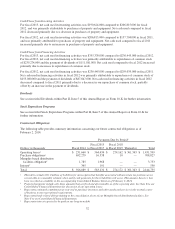
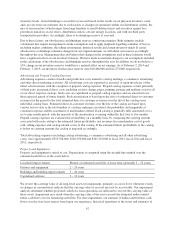
Contractual Obligations
The following table provides summary information concerning our future contractual obligations as of
February 2, 2014:
Payments Due by Period1
Dollars in thousands Fiscal 2014
Fiscal 2015
to Fiscal 2017
Fiscal 2018
to Fiscal 2019 Thereafter Total
Operating leases2$ 231,660 $ 564,434 $ 274,162 $ 361,343 $ 1,431,599
Purchase obligations3692,279 16,538 10 — 708,827
Memphis-based distribution
facilities obligation41,785 1,968 — — 3,753
Interest5365 191 — — 556
Total $ 926,089 $ 583,131 $ 274,172 $ 361,343 $ 2,144,735
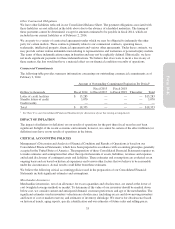
1This table excludes $13.0 million of liabilities for unrecognized tax benefits associated with uncertain tax positions as we
are not able to reasonably estimate when and if cash payments for these liabilities will occur. This amount, however, has
been recorded as a liability in the accompanying Consolidated Balance Sheet as of February 2, 2014.
2Projected payments include only those amounts that are fixed and determinable as of the reporting date. See Note E to our
Consolidated Financial Statements for discussion of our operating leases.
3Represents estimated commitments at year-end to purchase inventory and other goods and services in the normal course
of business to meet operational requirements.
4Represents bond-related debt pertaining to the consolidation of one of our Memphis-based distribution facilities. See
Note F to our Consolidated Financial Statements.
5Represents interest expected to be paid on our long-term debt.
32