Pottery Barn 2013 Annual Report Download - page 120
Download and view the complete annual report
Please find page 120 of the 2013 Pottery Barn annual report below. You can navigate through the pages in the report by either clicking on the pages listed below, or by using the keyword search tool below to find specific information within the annual report.-
 1
1 -
2
-
3
-
4
-
5
-
6
-
7
-
8
-
9
-
10
-
11
-
12
-
13
-
14
-
15
-
16
-
17
-
18
-
19
-
20
-
21
-
22
-
23
-
24
-
25
-
26
-
27
-
28
-
29
-
30
-
31
-
32
-
33
-
34
-
35
-
36
-
37
-
38
-
39
-
40
-
41
-
42
-
43
-
44
-
45
-
46
-
47
-
48
-
49
-
50
-
51
-
52
-
53
-
54
-
55
-
56
-
57
-
58
-
59
-
60
-
61
-
62
-
63
-
64
-
65
-
66
-
67
-
68
-
69
-
70
-
71
-
72
-
73
-
74
-
75
-
76
-
77
-
78
-
79
-
80
-
81
-
82
-
83
-
84
-
85
-
86
-
87
-
88
-
89
-
90
-
91
-
92
-
93
-
94
-
95
-
96
-
97
-
98
-
99
-
100
-
101
-
102
-
103
-
104
-
105
-
106
-
107
-
108
-
109
-
 110
110 -
 111
111 -
 112
112 -
 113
113 -
 114
114 -
 115
115 -
 116
116 -
 117
117 -
 118
118 -
 119
119 -
 120
120 -
 121
121 -
 122
122 -
 123
123 -
 124
124 -
 125
125 -
 126
126 -
 127
127 -
 128
128 -
 129
129 -
 130
130 -
131
-
132
-
133
-
134
-
135
-
136
-
137
-
138
-
139
-
140
-
141
-
142
-
143
-
144
-
145
-
146
-
147
-
148
-
149
-
150
-
151
-
152
-
153
-
154
-
155
-
156
 |
 |
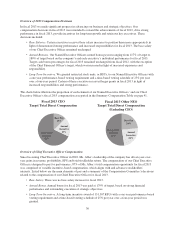
upholstered furniture manufacturing operations and our personalization capabilities, and we made
progress in taking over our agent sourcing relationships.
•Technology and infrastructure investment – We continued to invest in technology to support our
multi-channel business. E-commerce represented 44% of our net revenues, and we believe the
investments we are making in technology to redefine the customer experience are allowing us to provide
the best level of service to our customers.
The results demonstrate that our execution and financial discipline allow us to deliver sustainable returns and
increase stockholder value. We have built a portfolio of brands that provide continuing opportunities for growth
and market share gains.
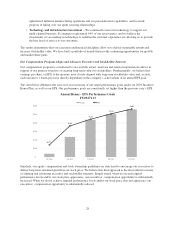
Our Compensation Program Aligns and Advances Executive and Stockholder Interests
Our compensation program is constructed to successfully attract, motivate and retain exceptional executives in
support of our primary objective of creating long-term value for stockholders. Fundamentally, we believe that
earnings per share, or EPS, is the measure most closely aligned with long-term stockholder value and, as such,
each executive’s bonus payout is directly dependent on the company’s achievement of an annual EPS goal.
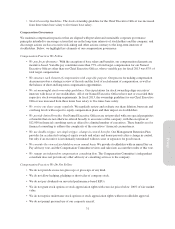
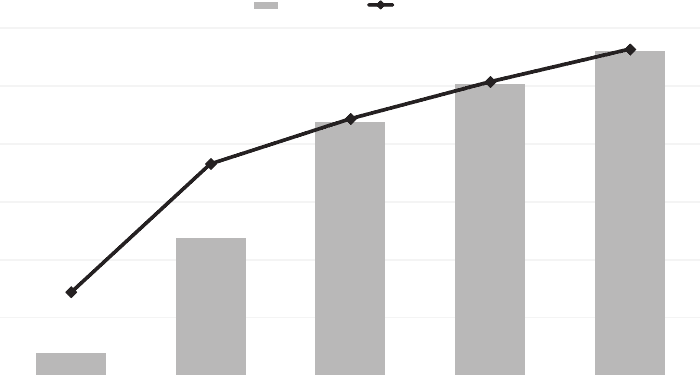
The chart below illustrates the year over year increases of our target performance goals under our 2001 Incentive
Bonus Plan, as well as our EPS. Our performance goals are consistently set higher than the previous year’s EPS.
$0.72
$1.83
$2.22
$2.54
$2.82
$-
$0.50
$1.00
$1.50
$2.00
$2.50
$3.00
FY 2009 FY 2010 FY 2011 FY 2012 FY 2013
Annual Bonus - EPS Performance Goals
FY09-FY13
Target EPS
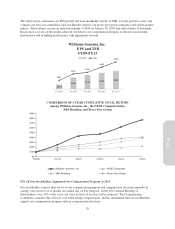
Similarly, our equity compensation and stock ownership guidelines are structured to encourage our executives to
deliver long-term sustained growth in our stock price. We believe this dual approach is the most effective means
of aligning and advancing executive and stockholder interests. Simply stated, when we exceed targeted
performance levels and/or our stock price appreciates, our executives’ compensation opportunity is substantially
increased. When we do not achieve targeted performance levels and/or our stock price does not appreciate, our
executives’ compensation opportunity is substantially reduced.
28